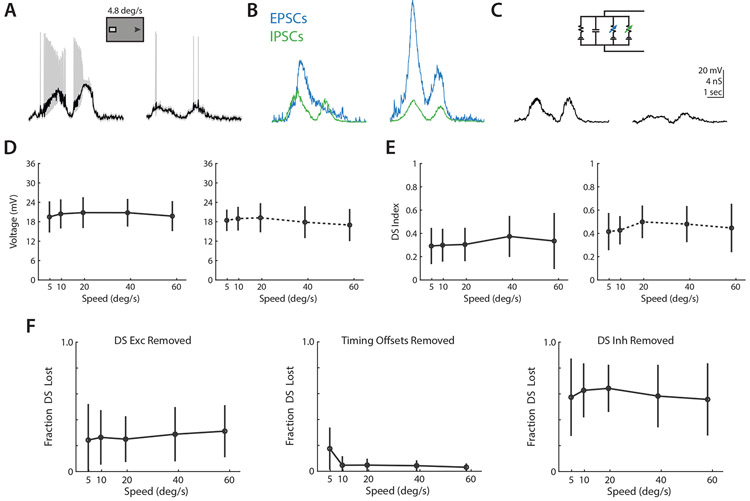
Figure 5. Conductance modeling indicates that asymmetric inhibition is the primary determinant of directional tuning.
(A) Example preferred (left) and null (right) direction ON-OFF DSGC depolarizations, after removal of spikes via lowpass filtering. (B) Example EPSCs (green, smaller) and IPSCs (blue, larger) recorded from an ON-OFF DSGC in response to preferred (left) and null (right) bars as in A. (C) Example depolarizations from numerical integration of preferred (left) and null (right) conductances from B in a simple parallel conductance model, using forward Euler method. (D) Comparison of depolarizations measured in current clamp (left) and via conductance modeling (right). Markers show population averaged responses, and error bars show standard deviation. (E) Same as D, but for direction selectivity. (G) Velocity tuning of fractional direction selectivity loss for conductance model manipulations removing directional excitation (left), differential timing offsets (middle), and directional inhibition (right). Markers show population averaged responses, and error bars show standard deviation. See also Figure S5.

