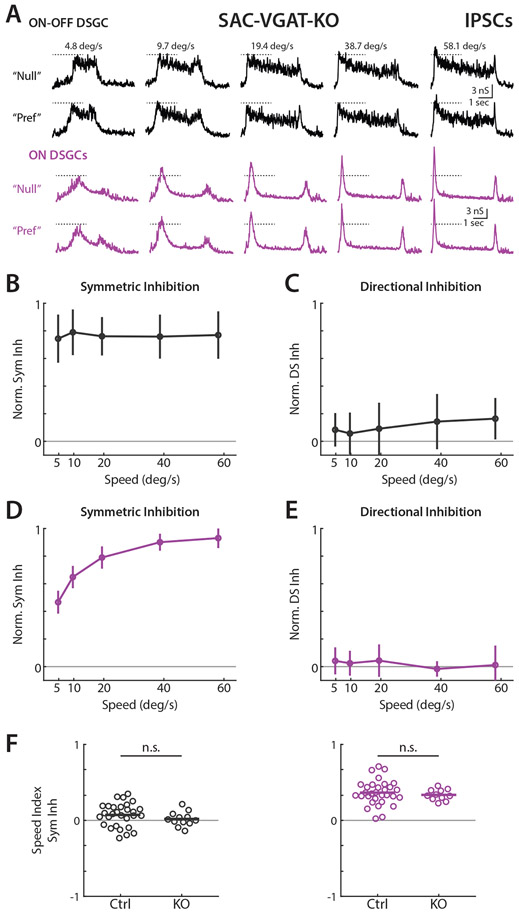
Figure 6. Elimination of GABA release from SACs reduces directionally tuned inhibition across all velocities in ON and ON-OFF DSGCs.
(A) Example ON-OFF (black) and ON (purple) DSGC IPSCs for elongated bar stimuli in Hoxd10-GFP / Vgatflox/flox/ Chat-IRES-Cre mice. Dashed lines indicate IPSC amplitude at the lowest tested velocity. (B) Population-averaged velocity tuning curves of symmetric inhibition in KO mice normalized to cell’s maximal IPSC. Error bars show standard deviation. (C) Population-averaged velocity tuning curves of directional inhibition normalized to cell’s maximal IPSC. (D-E) Same as B-C, but for ON DSGCs. (F) Symmetric inhibition speed indices in control and knockout animals. Comparison made via two-sided Wilcoxon rank-sum test; ON-OFF IPSCs, NS, P = 0.19, 29 cells in 19 control mice and 12 cells in 5 knockout animals. ON IPSCs, NS, P = 0.61, 31 cells in 21 control mice and 11 cells in 6 knockout animals. See also Figure S6 and Table S1.

