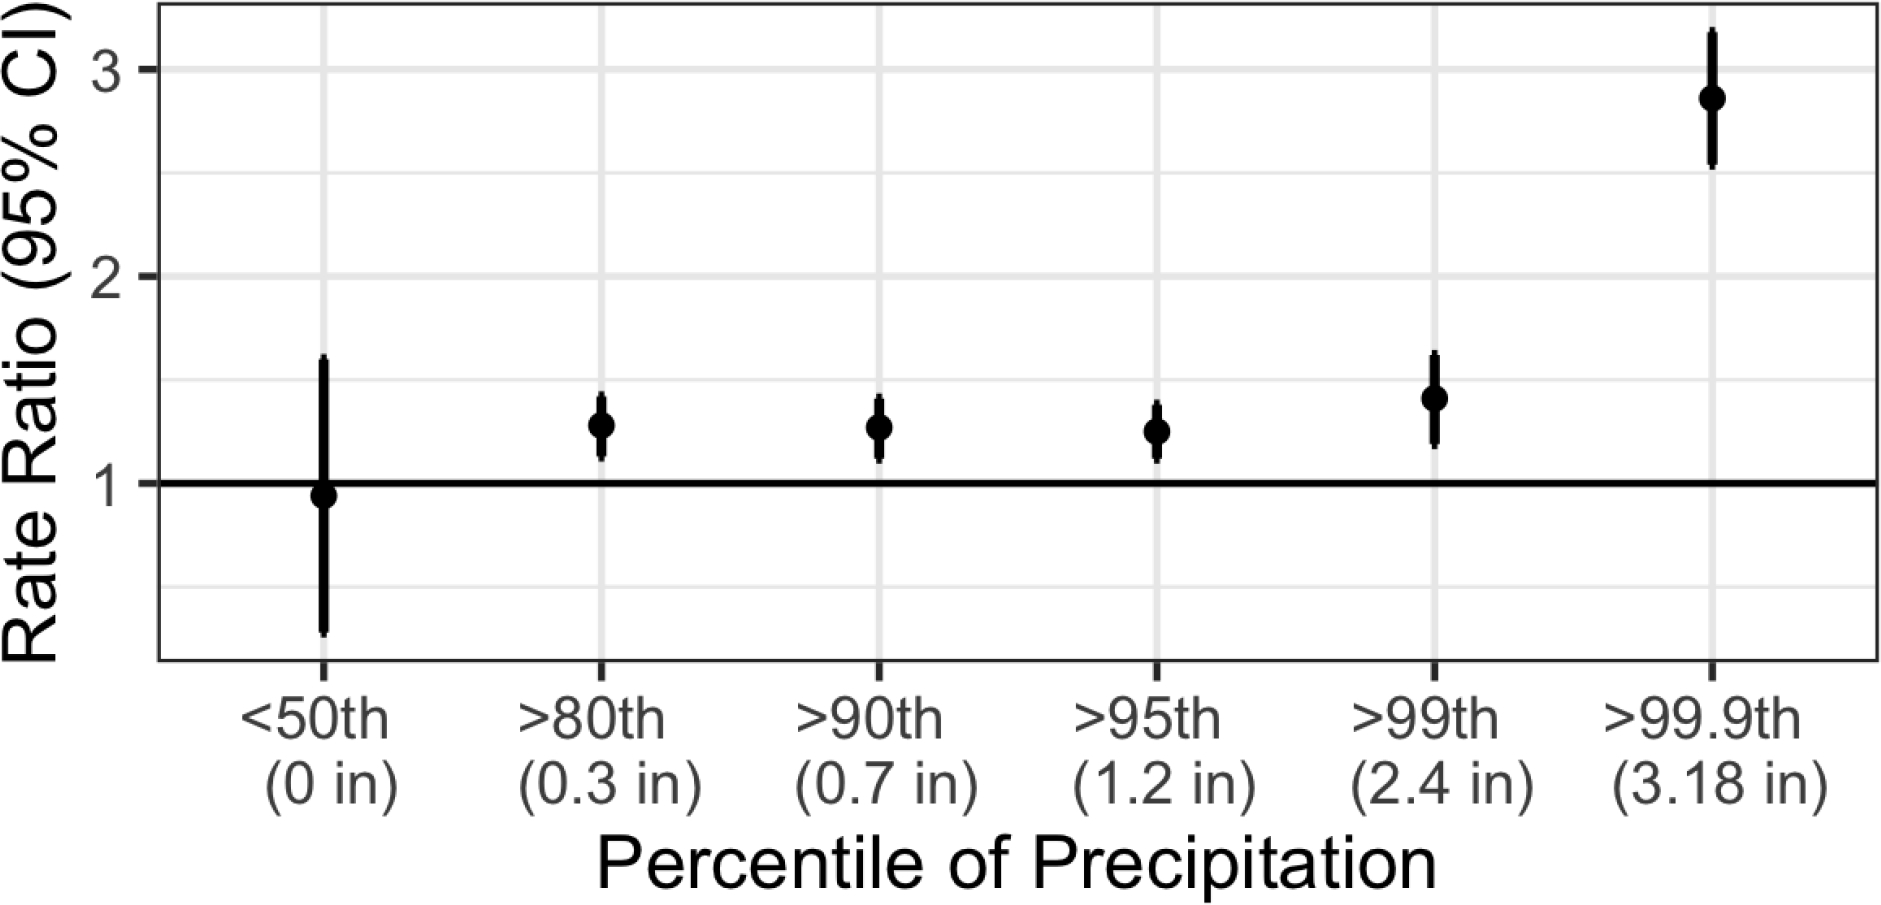
Figure 3.

The association between high hog CAFO exposure (>75th percentile of distance weighted hog CAFO measure) and AGI ED rate (2016–2019) restricted across a range of daily precipitation measures. These heavy precipitation analyses include all AGI ED visits during the seven days after each day of precipitation above a given percentile. For example, for the >99th percentile of precipitation analysis, we included only AGI ED visits when the daily ZIP code precipitation was above the 99th percentile of NC daily precipitation during at least one of the prior seven days. For the <50th percentile of precipitation analysis, we only included AGI ED visits when the daily ZIP code precipitation was below the 50th percentile of NC daily precipitation during all of the prior seven days. As the 50th percentile was 0 inches, this analysis included only areas and days with no precipitation in the previous week. CAFO proximity was most associated with increased AGI after periods of heaviest precipitation.
