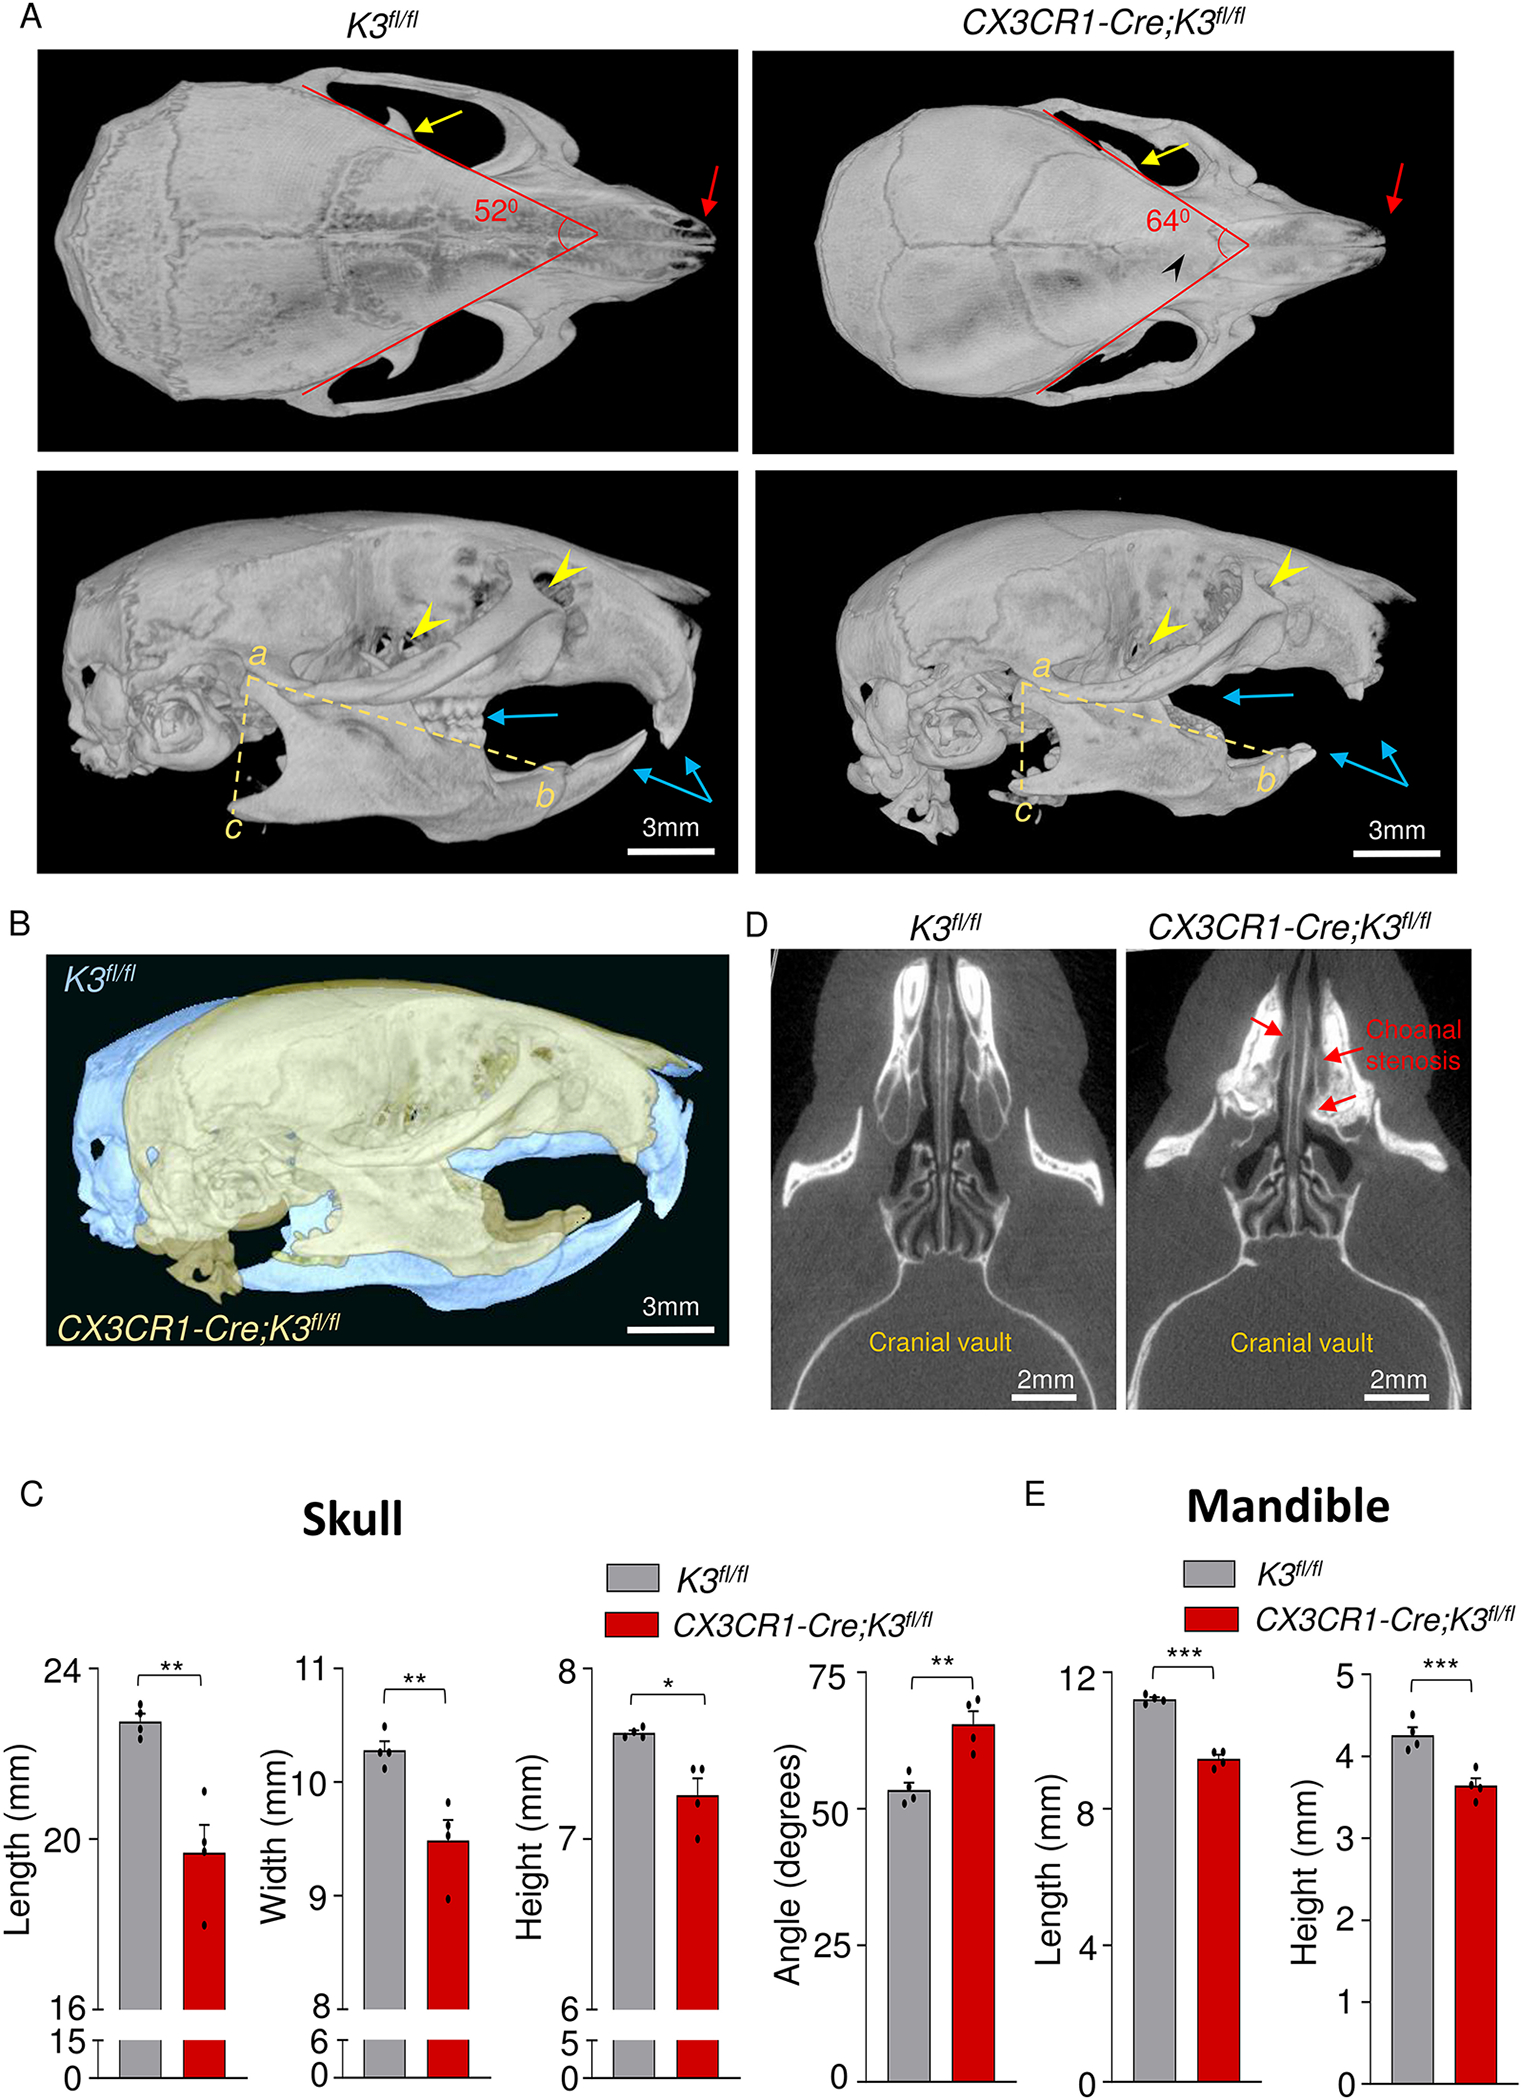
Figure 2: Dome-shaped skull and micrognathia in embryonic Kindlin3-deficient mice.

A. Top (top panel) and side views (bottom panel) of skull and mandible obtained from micro-CT scans of 4-month-old K3fl/fl and CX3CR1-Cre;K3fl/fl mice. CX3CR1-Cre;K3fl/fl mice show cranial sclerosis and fused interfrontal suture (black arrowhead, top panel) and a dome-shaped skull (bottom panel). Red arrows point to the differences in nasal bone structure in the top panel. The yellow arrows in the top panels point to the coronoid process of the mandible. The lower panel shows the increased curvature of the skull and smaller mandible with missing and abnormal teeth (blue arrows) in CX3CR1-Cre;K3fl/fl. Yellow arrowheads in the bottom panel indicate the point to the optic canal and infraorbital foramen. B. An overlay of K3fl/fl (yellow) and CX3CR1-Cre;K3fl/fl (blue) 4-month-old skulls exhibiting a smaller overall skull size and abnormal shape. The same thresholding and scale bars were applied to both skulls. C. Bar graphs showing quantification of skull length, width, height, and angle (n=4 mice/group). In every instance, CX3CR1-Cre;K3fl/fl mice had a significantly smaller length, width, and height, further indicating that the overall skull size is smaller compared to K3fl/fl. The angles obtained from the red lines in the top left and right panels of A show that the CX3CR1-Cre;K3fl/fl mice had a wider skull compared to K3fl/fl. D. Axial plane micro-CT scan showing the posterior nasal aperture (choanae) of mice. CX3CR1-Cre;K3fl/fl mice show narrowing or complete blockage of the choanae (choanal stenosis), as indicated by the red arrows. E. Bar graphs showing quantification of mandible parameters. The yellow dashed lines in the bottom left and right panels of A were used to estimate mandible length (ab) and height (ac) (n=4 mice/group). The CX3CR1-Cre;K3fl/fl mice had both smaller mandible length and height compared to K3fl/fl. *p-value <0.05, **p-value <0.01, ***p-value <0.001. Data shown represent mean ± SEMs. Statistics performed were 2-sample Student’s t-tests.
