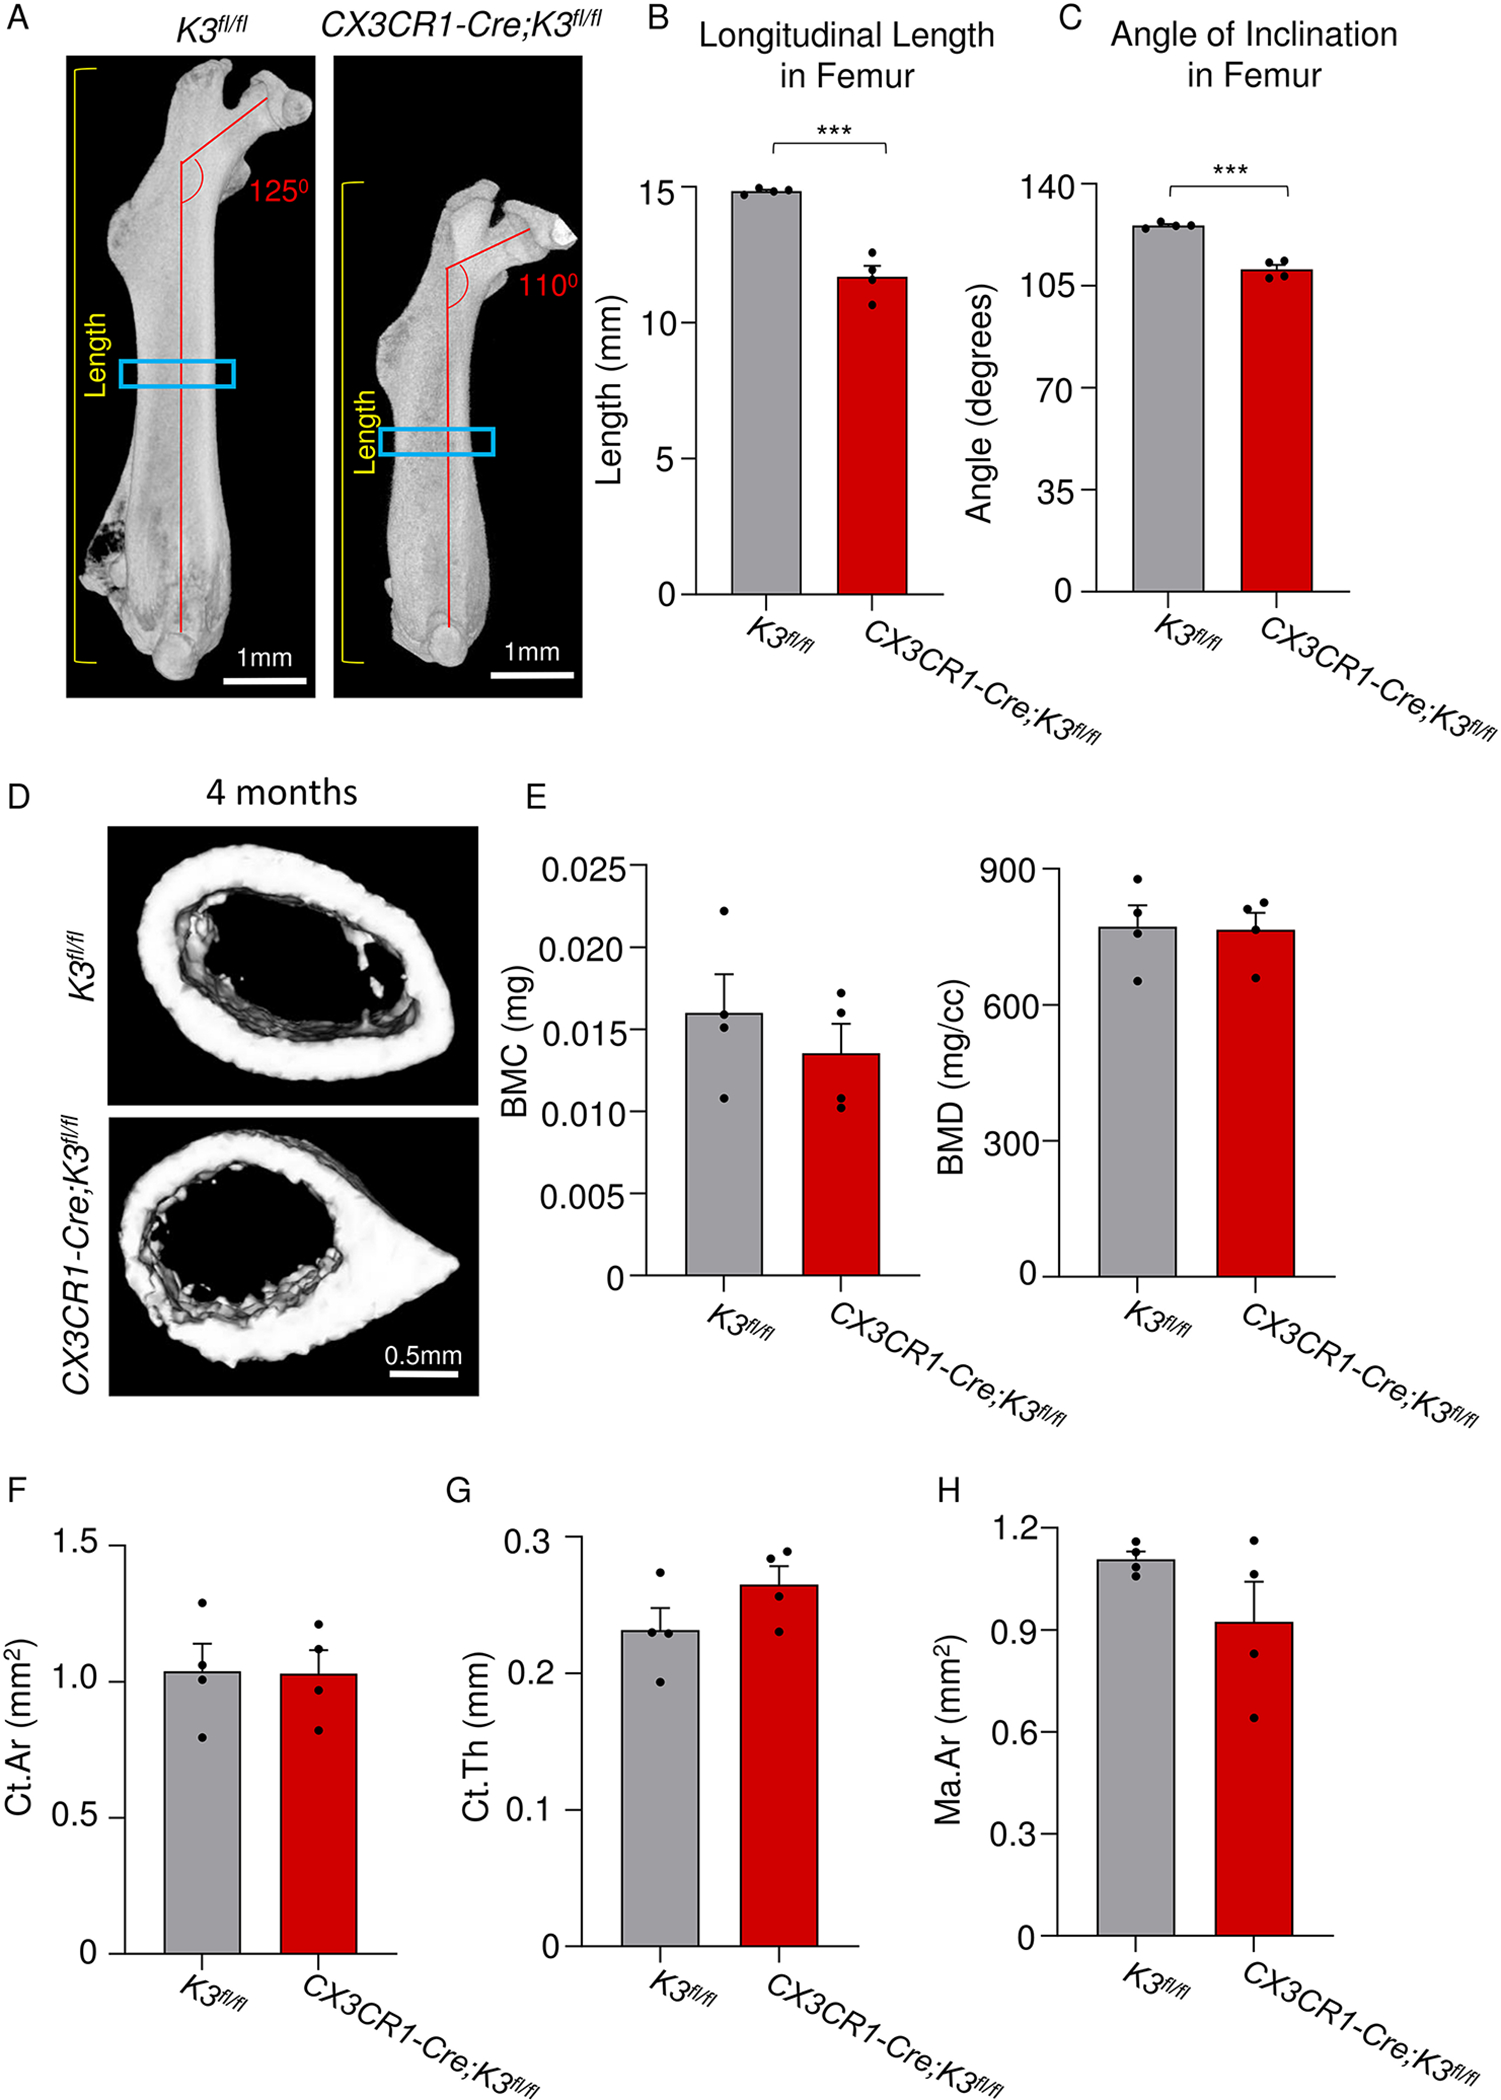
Figure 3: Abnormal long-bone architecture with normal cortical bone parameters in embryonic Kindlin3-deficient mice.

A. Side view of the right femur for 4-month-old K3fl/fl and CX3CR1-Cre;K3fl/fl mice. Yellow lines on both panels indicate how the length of the femur was obtained. Red lines show the abnormal femoral neck-shaft angle of CX3CR1-Cre;K3fl/fl mice. Blue boxes indicate the location of where the ROIs were taken for cortical analysis. The same thresholding and scale bars were applied to both images. B. Bar graph showing quantification of the longitudinal length of the femur (yellow lines in panel A; n=4 mice/group). CX3CR1-Cre;K3fl/fl mice had a significantly shorter length compared to K3fl/fl mice, indicating abnormal longitudinal growth. C. Bar graph showing quantification of the angle of inclination in the femoral neck (red lines in panel A; n=4 mice/group). CX3CR1-Cre;K3fl/fl mice had a significantly smaller angle (110.6 ± 1.5) exhibiting a coxa vara phenotype consistent with osteopetrosis. D. Top (K3fl/fl) and bottom (CX3CR1-Cre;K3fl/fl) panels represent 1-mm sections taken distally at the mid-diaphysis from the right femur. The same thresholding and scale bars were applied to both images. E. Bar graphs representing the values obtained for cortical analysis by Microview Bone Analysis. BMC (bone mineral content) and BMD (bone mineral density) values from ROIs in D (n=4 mice/group). There were no statistically significant differences between K3fl/fl and CX3CR1-Cre;K3fl/fl mice. F. Bar graphs representing the values obtained for cortical analysis by Microview Bone Analysis. Ct.Ar (cortical area), Ct.Th (cortical thickness), and Ma.Ar (marrow area) values from ROIs in D (n=4 mice/group). There were no statistically significant differences between K3fl/fl and CX3CR1-Cre;K3fl/fl mice. ***p-value <0.001. Data shown represent mean ± SEMs. Statistics performed were 2-sample Student’s t-tests.
