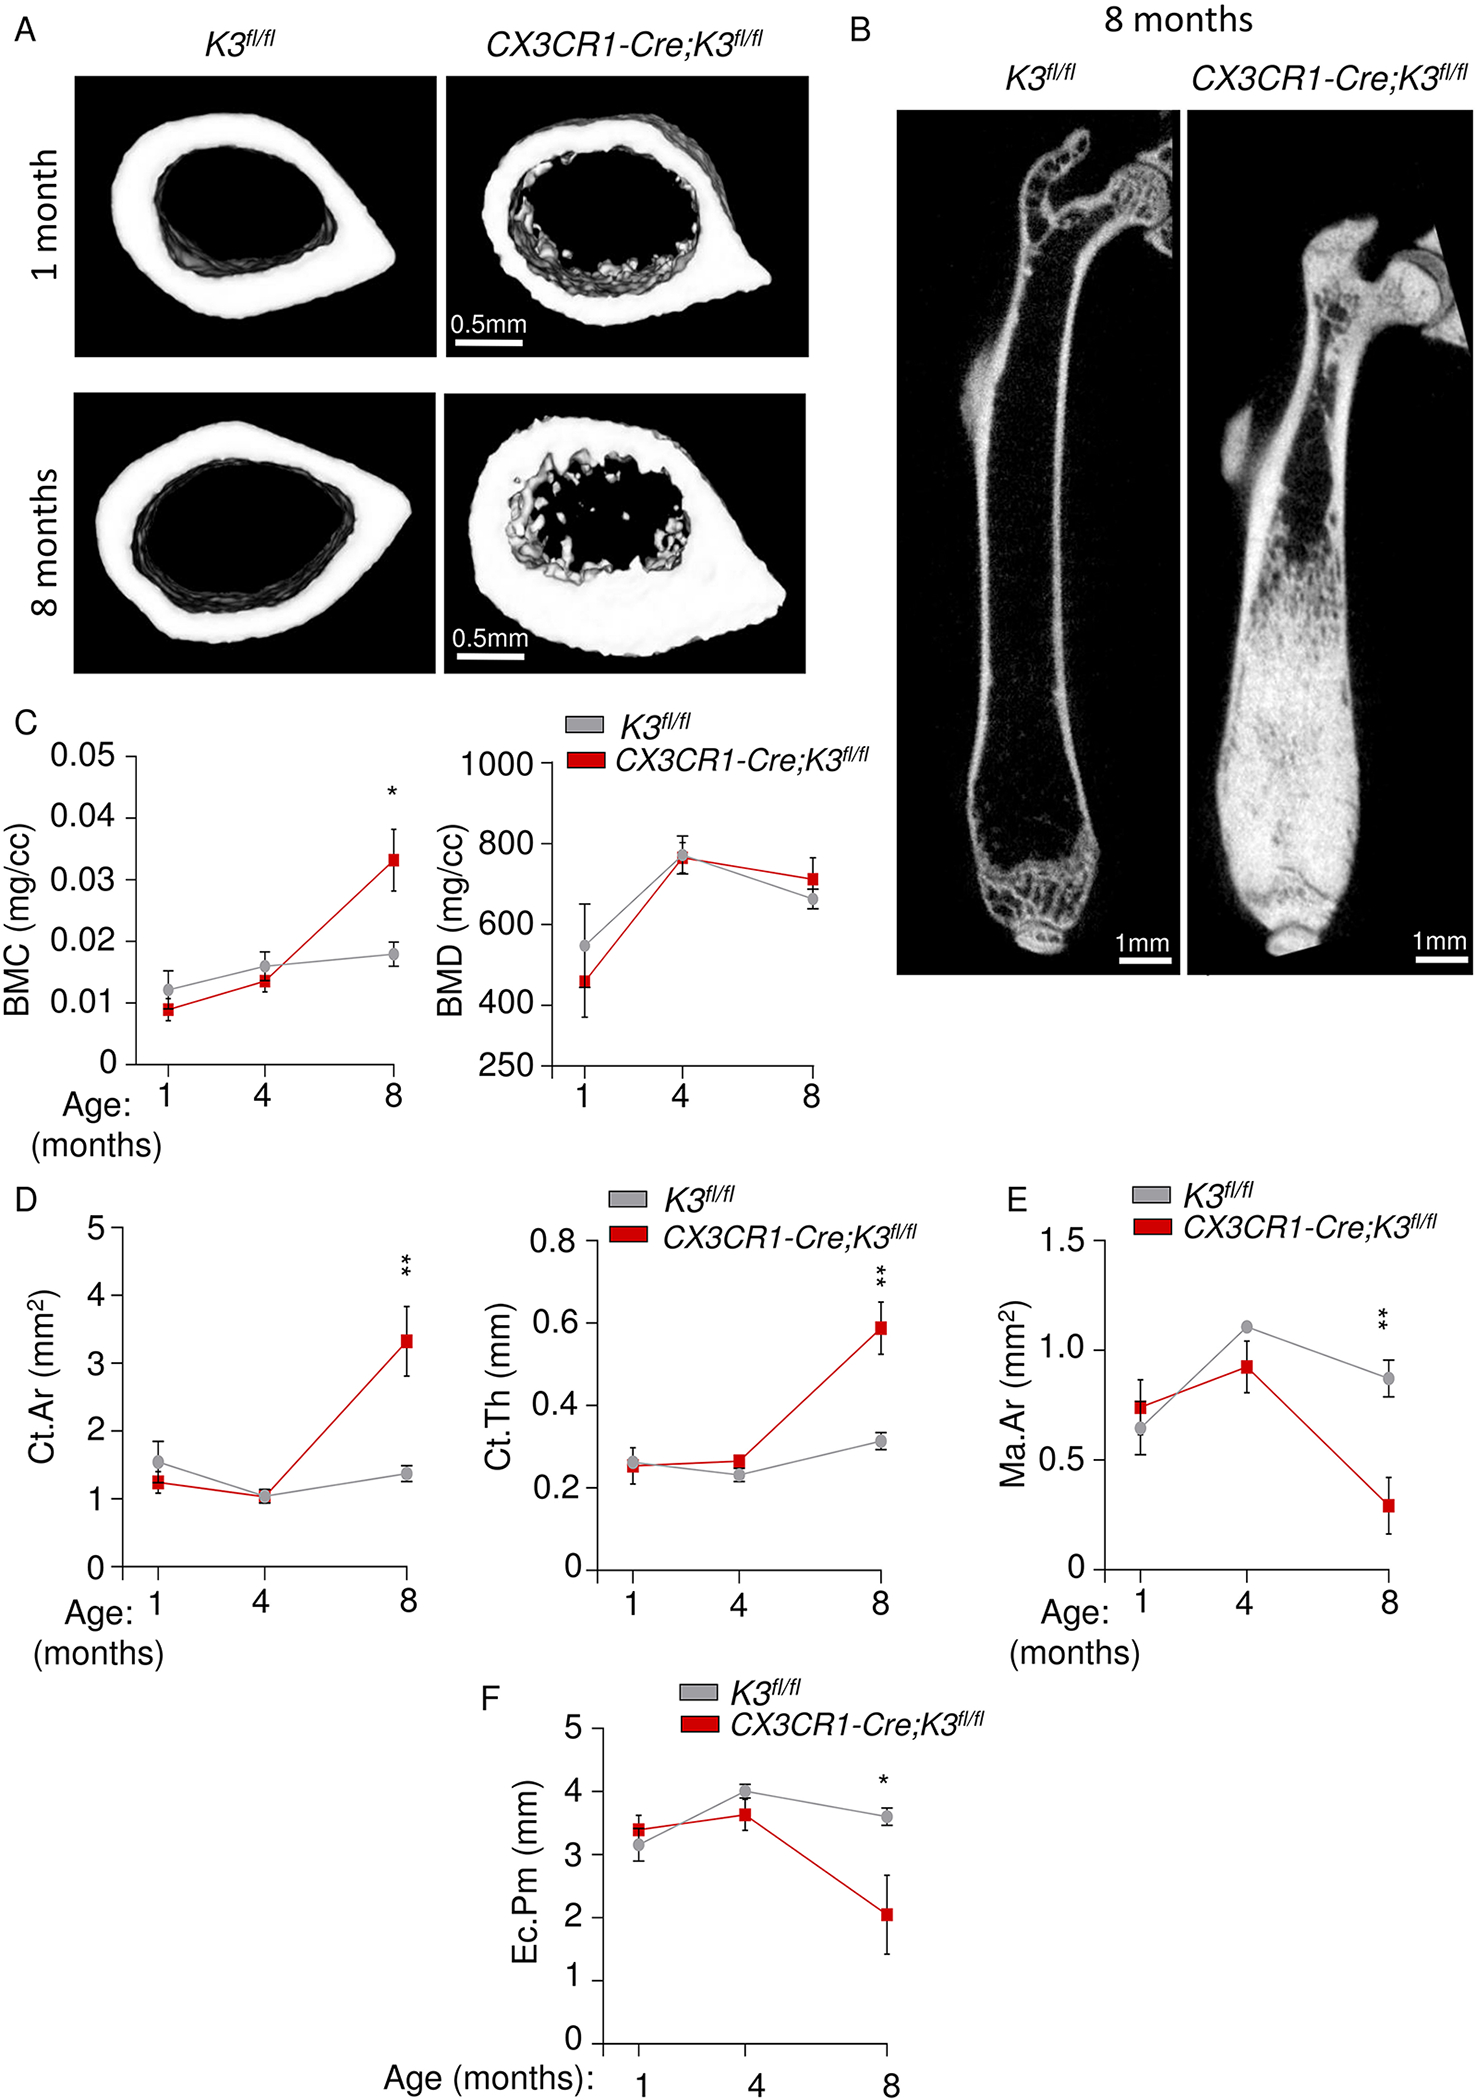
Figure 4: Cortical bone analysis of embryonic Kindlin3-deficient mice at different stages of life.

A. Representative images of 1-mm cortical bone sections taken distally at the mid-diaphysis from the right femur of 1- (top panel) and 8-month old (bottom panel) K3fl/fl and CX3CR1-Cre;K3fl/fl mice. B. Representative cross-sectional view of the right femur from 8-month-old mice showing a near complete absence of central bone marrow cavity in CX3CR1-Cre;K3fl/fl mice. C. Line graphs representing the progression of BMC and BMD values from ROIs in 4A (1 month), 3D (4 months), and 4B (8 months) (n=4 mice/group). A significant increase in BMC is seen only in 8-month-old CX3CR1-Cre;K3fl/fl mice. D. Line graphs representing the progression of Ct.Ar and Ct.Th values from the ROIs used above (n=4 mice/group). The CX3CR1-Cre;K3fl/fl mice showed a significant increase in Ct.Ar and Ct.Th at 8 months. E, F. Line graphs representing the progression of marrow area (Ma.Ar) and Ec.Pm (endocortical perimeter) values from the ROIs above (n=4 mice/group). A significant decrease in Ma.Ar and Ec.Pm is seen in CX3CR1-Cre;K3fl/fl mice only at 8 months. *p-value <0.05, **p-value <0.01. Data shown represent mean ± SEMs. Statistics performed were 2-sample Student’s t-tests.
