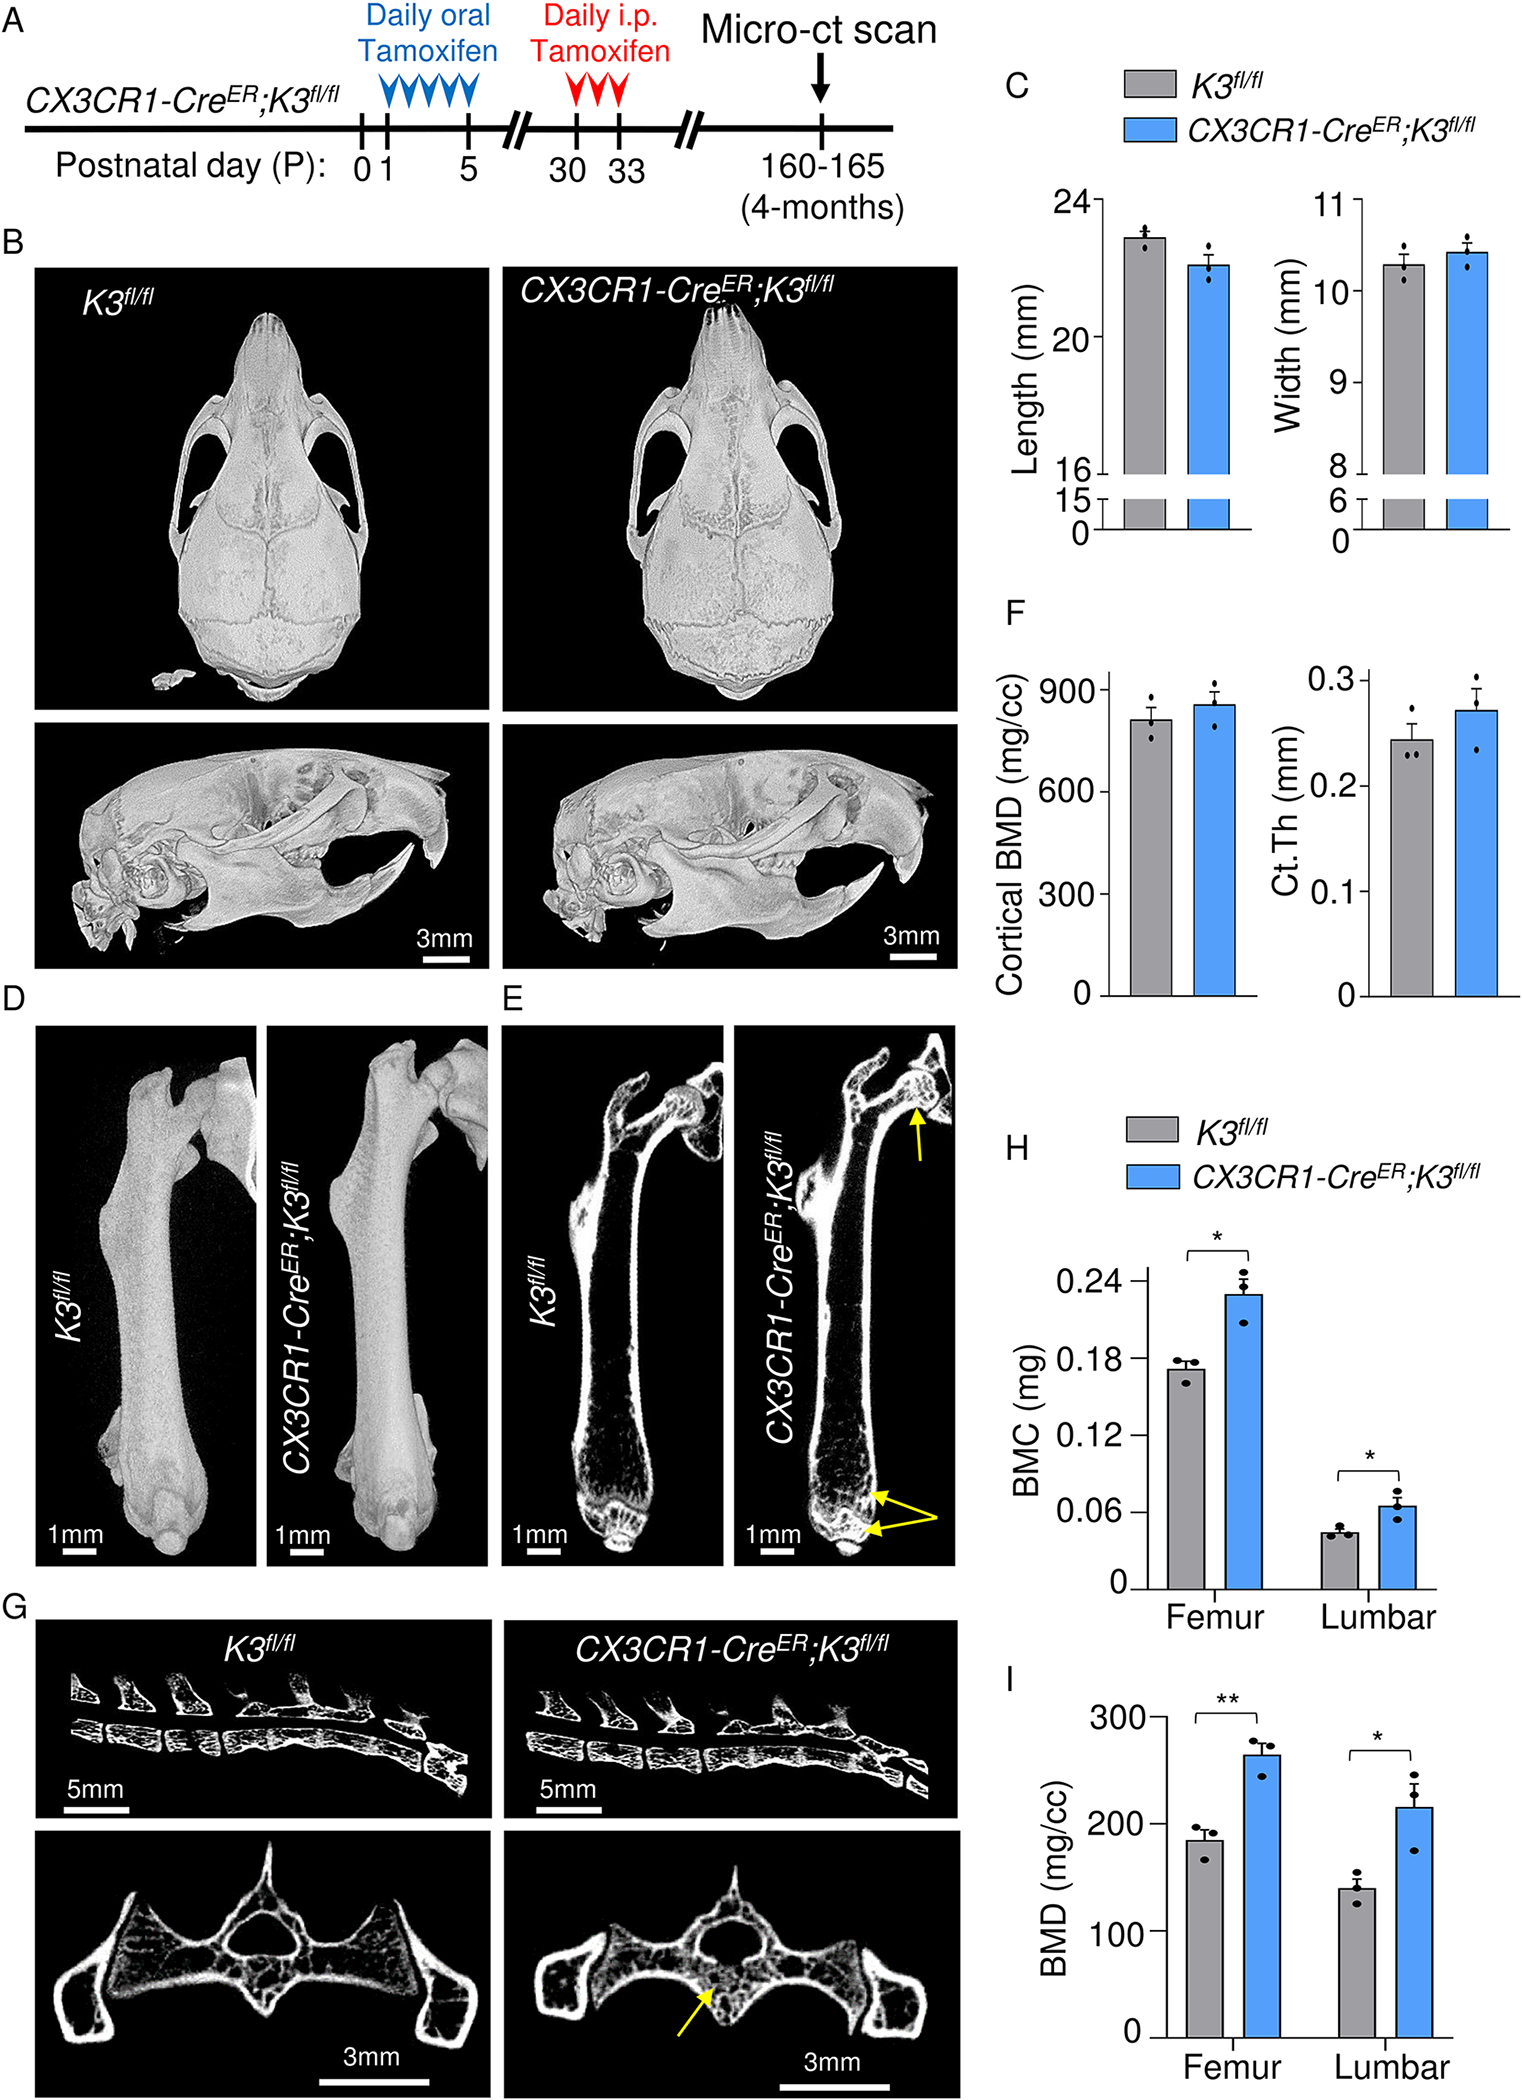
Figure 7: Mild osteopetrosis in postnatal Kindlin3-deficient mice.

A. CX3CR1-CreER;K3fl/fl mice were administered tamoxifen orally from P1 to P5 (red arrowheads) and injected on P30 for three consecutive days (red arrowheads). Micro-CT scans were taken at 4 months (indicated by black arrows). B. Top (top panel) and side views (bottom panel) of skull and mandible obtained from micro-CT scans of 4-month-old K3fl/fl and CX3CR1-CreER;K3fl/fl mice. No significant differences in teeth, skull shape, mandible, or foramen were observed between the two genotypes. C. Bar graphs showing quantification of skull length and width (n=3 mice/group). D. Side view of the right femur from 4-month-old K3fl/fl and CX3CR1-CreER;K3fl/fl mice. E. Representative cross-sectional views of the right femur from 4-month-old K3fl/fl and CX3CR1-CreER;K3fl/fl mice. Yellow arrows indicate sclerosis at the proximal epiphysis (femoral head), metaphysis, and distal epiphysis. F. Bar graphs representing the BMD and Ct.Th values obtained for cortical analysis ROIs in D (n=3 mice/group). G. Top panels are representative cross-sectional views of the spine from 4-month-old K3fl/fl and CX3CR1-CreER;K3fl/fl mice. Lower panels represent a cross-sectional view of L6 vertebra and pelvis. Yellow arrows indicate sclerosis of the trabecular compartment in the body of L6. H, I. Bar graphs representing the BMC and BMD values obtained from trabecular bone analysis of femur and L5 vertebra. They were significantly higher in both femur and vertebra of CX3CR1-CreER;K3fl/fl mice (n=3 mice/group). *p-value <0.05, **p-value <0.01. Data shown represent mean ± SEMs. Statistics performed were 2-sample Student’s t-tests.
