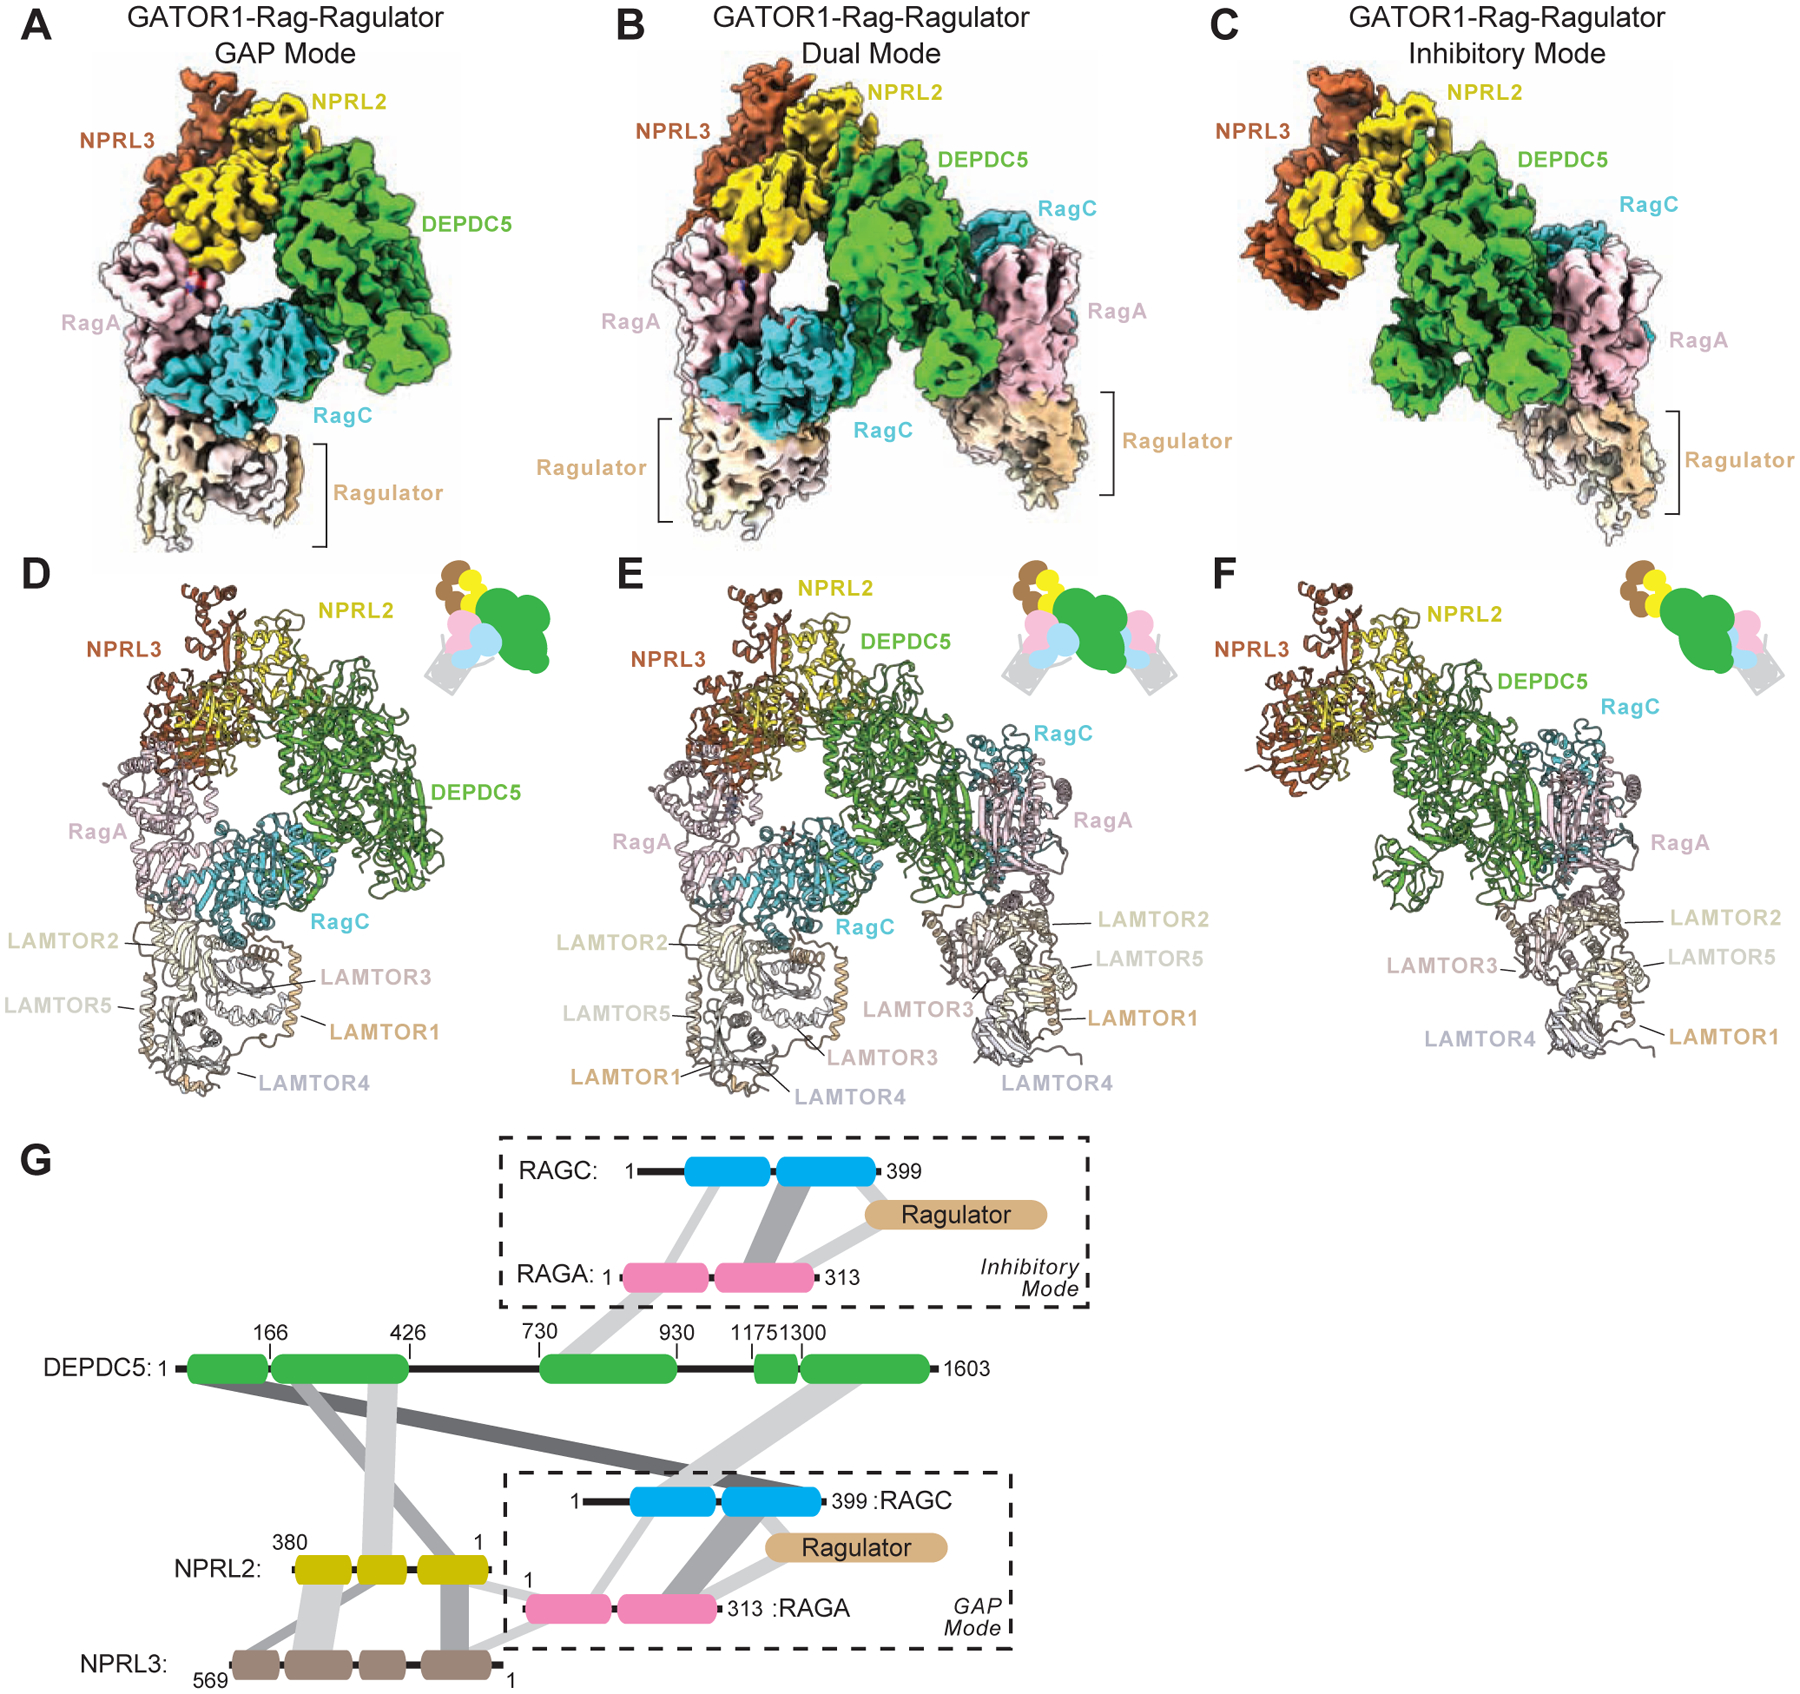
Figure 3. Cryo-EM structural models of the GATOR1-Rag-Ragulator complex.

A–C. Cryo-EM density maps for the GATOR1-Rag-Ragulator complex in G-mode (A, EMD-25653), D-mode (B, EMD-25654), and I-mode (C, EMD-25652). Subunits were colored as following: DEPDC5 in green, NPRL2 in yellow, NPRL3 in brown, RagA in pink, RagC in cyan, LAMTOR1 (p18) in light brown, LAMTOR2 (p14) in light yellow, LAMTOR3 (MP1) in light pink, LAMTOR4 (c7orf59) in light purple, and LAMTOR5 (HBXIP) in beige.
D–F. Atomic models for the GATOR1-Rag-Ragulator complex in G-mode (D, PDB:7T3B), D-mode (E, PDB:7T3C), and I-mode (F, PDB:7T3A). Subunits were colored the same as above.
G. Interaction graph within the GATOR1-Rag-Ragulator complex.
