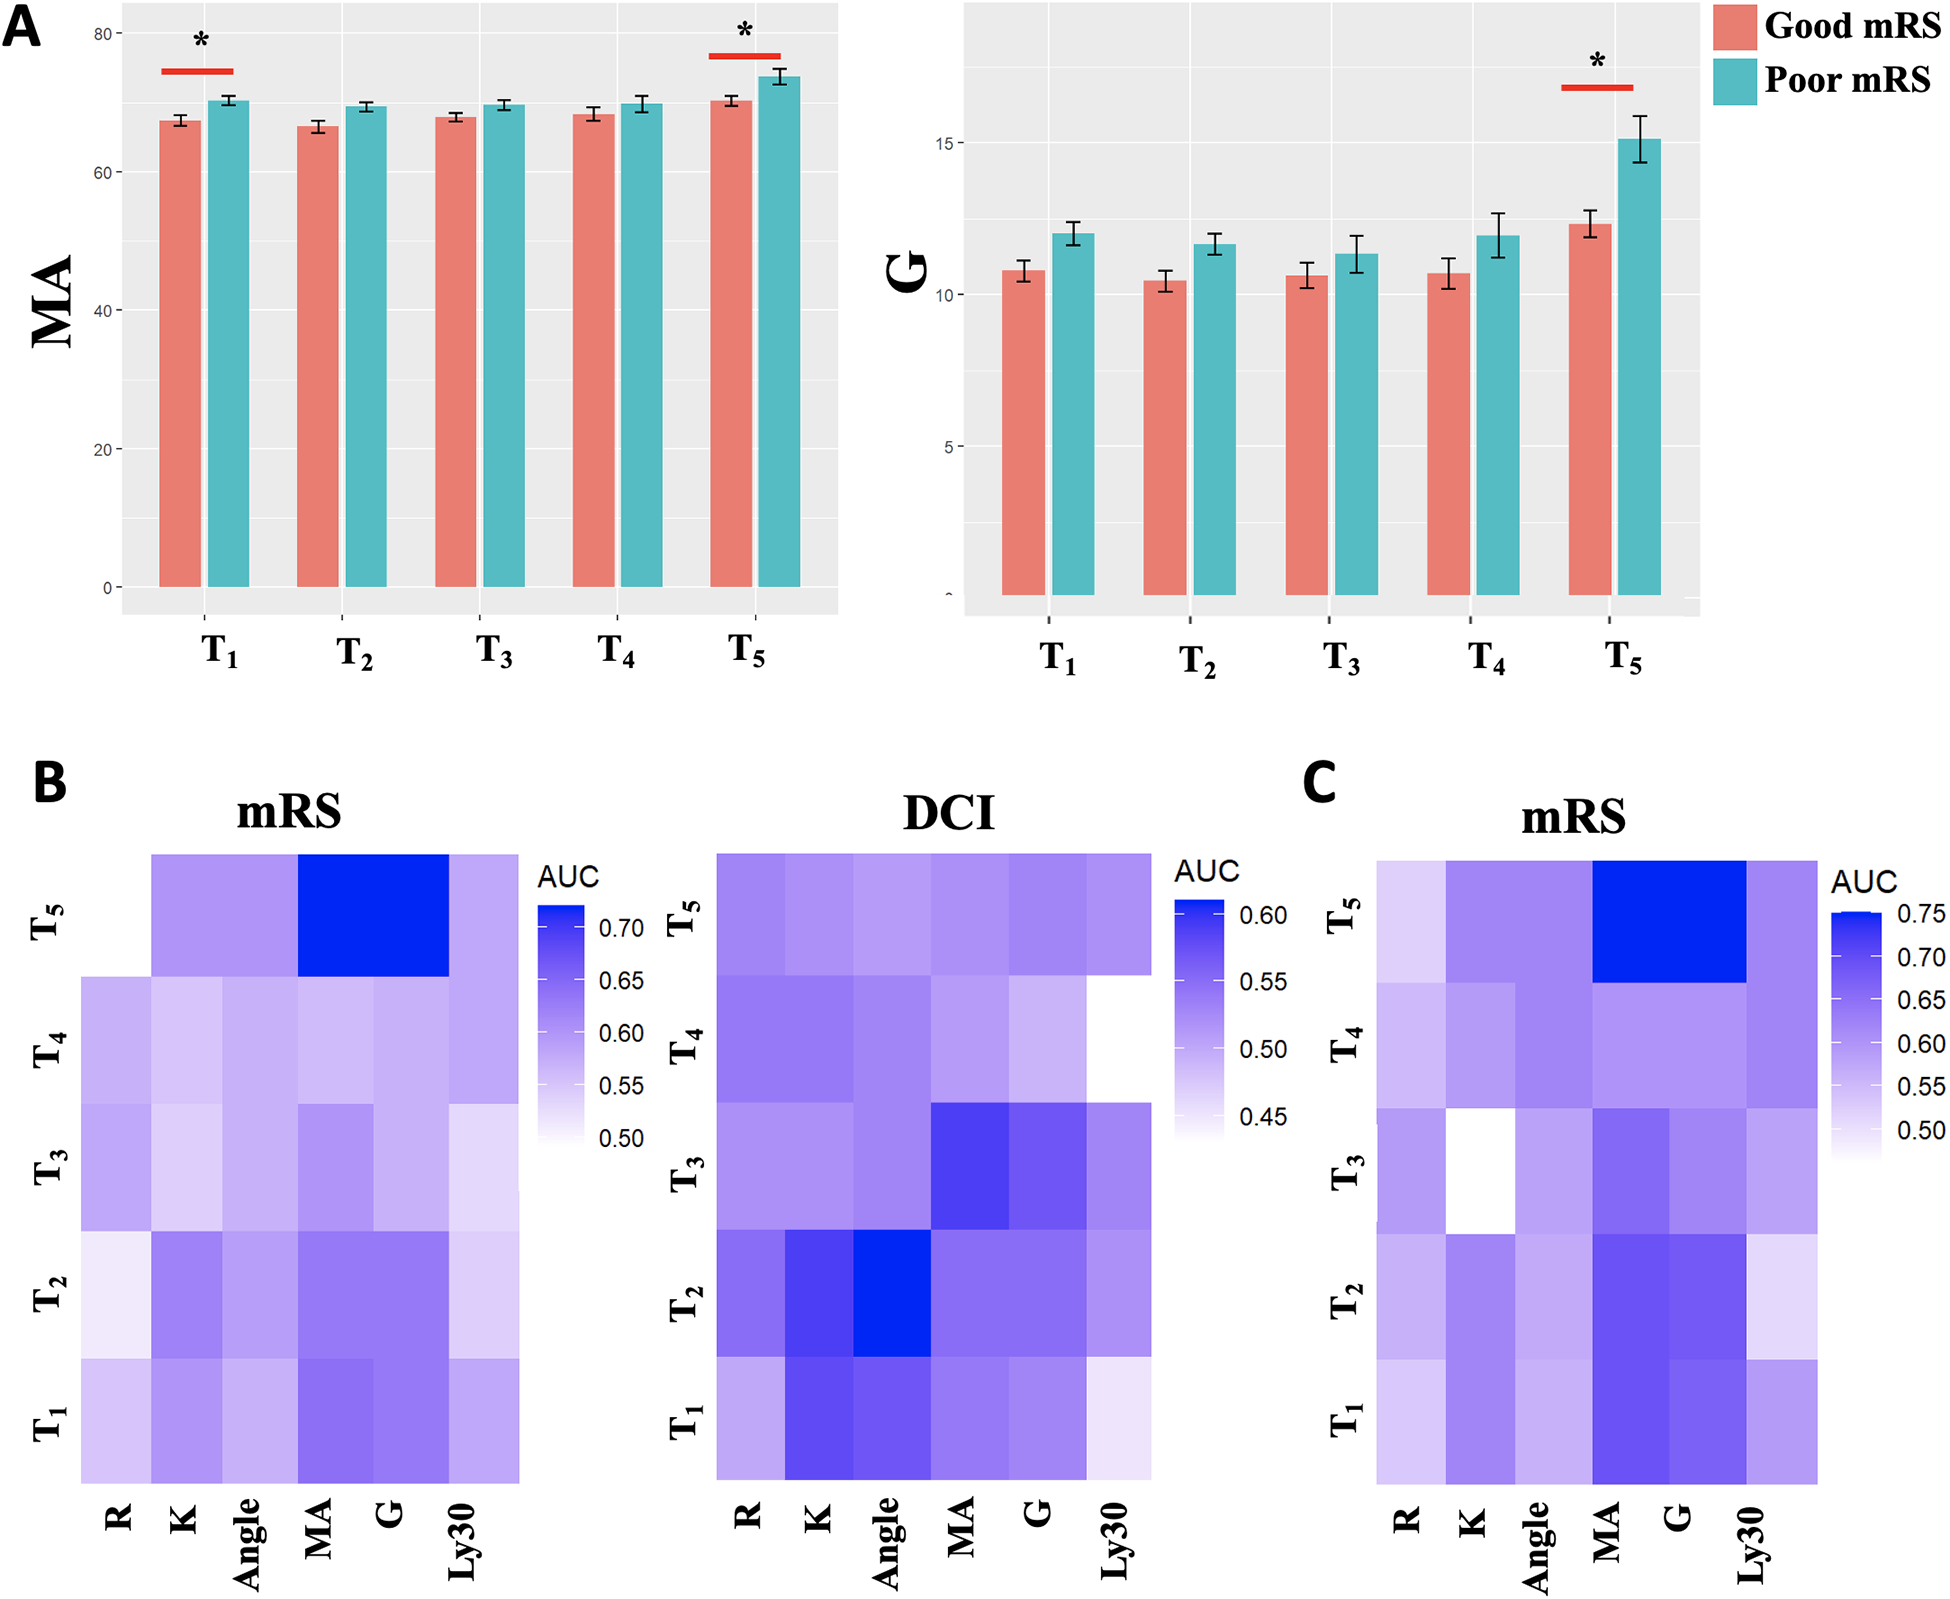
Figure 1.

(A)MA values across time in relation to 3-month modified Rankin Scale(mRS). Asterix indicates significant difference on multivariate analysis. (B)Heatmap showing the area under the curve(AUC) for TEG indices across time to predict 3-month mRS(left) or delayed cerebral ischemia(right). (C)Heatmap for patients not on antiplatelets therapy
