
Figure 1.
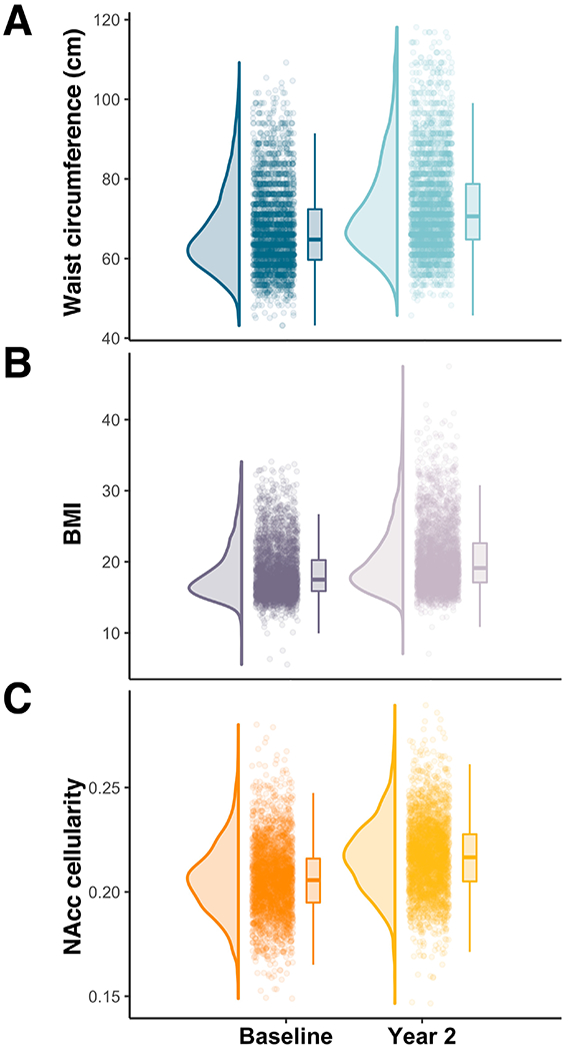
Two-year change in waist circumference and NAcc cellularity. Raincloud plots of waist circumference (A), BMI (B), and RSI-based NAcc cellularity (C) at baseline and at Year 2 follow-up. Sex-specific WC and BMI distributions are visualized in Figure S2.