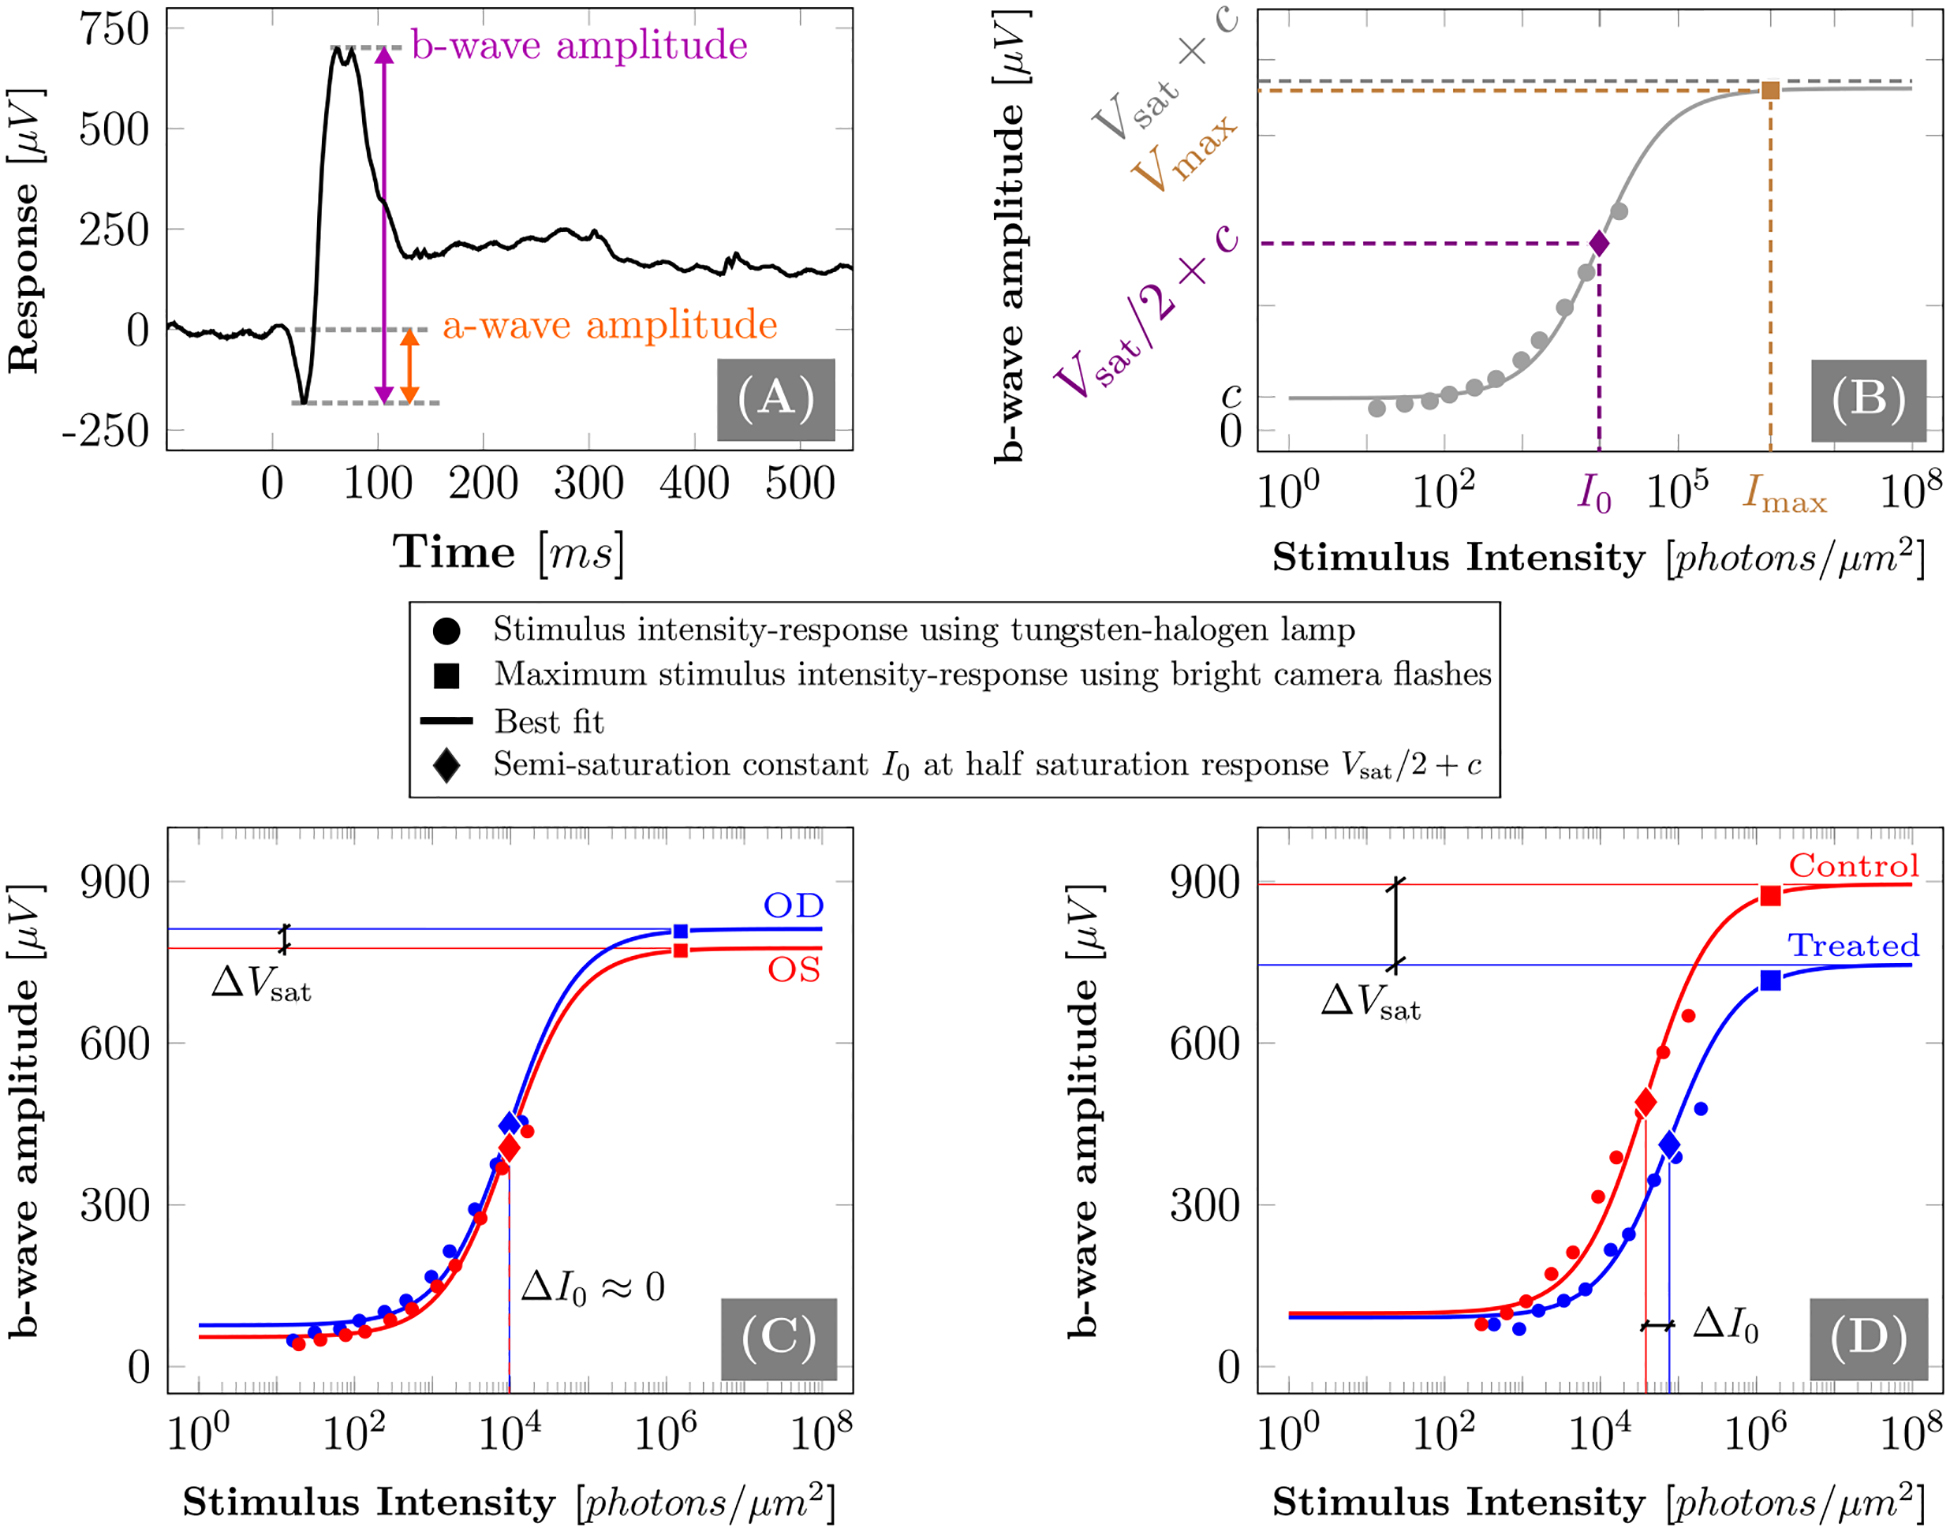
Figure 4:

A: A representative ERG trace of a tree shrew eye showing the a- and b-wave. B: An illustration of the intensity-response relationship. Filled circles and squares represent the experimentally measured stimulus-response at different stimulus intensities using the tungsten-halogen lamp and camera flashes, respectively. The solid line represents the best fit of the Naka–Rushton model. Filled diamonds represent the semi-saturation response Vsat/2 + c at I0, where Vsat and I0 represents the fitted saturation response amplitude and semi-saturation stimulus constant, respectively. Vmax represents the experimentally measured response at the maximum intensity Imax that was used during each ERG recording. C, D: Two representative examples of the b-wave intensity-response relationship data and the fitted Naka–Rushton model (Eq. 1) of a normal (C) and genipin treated experimental subject (D).
