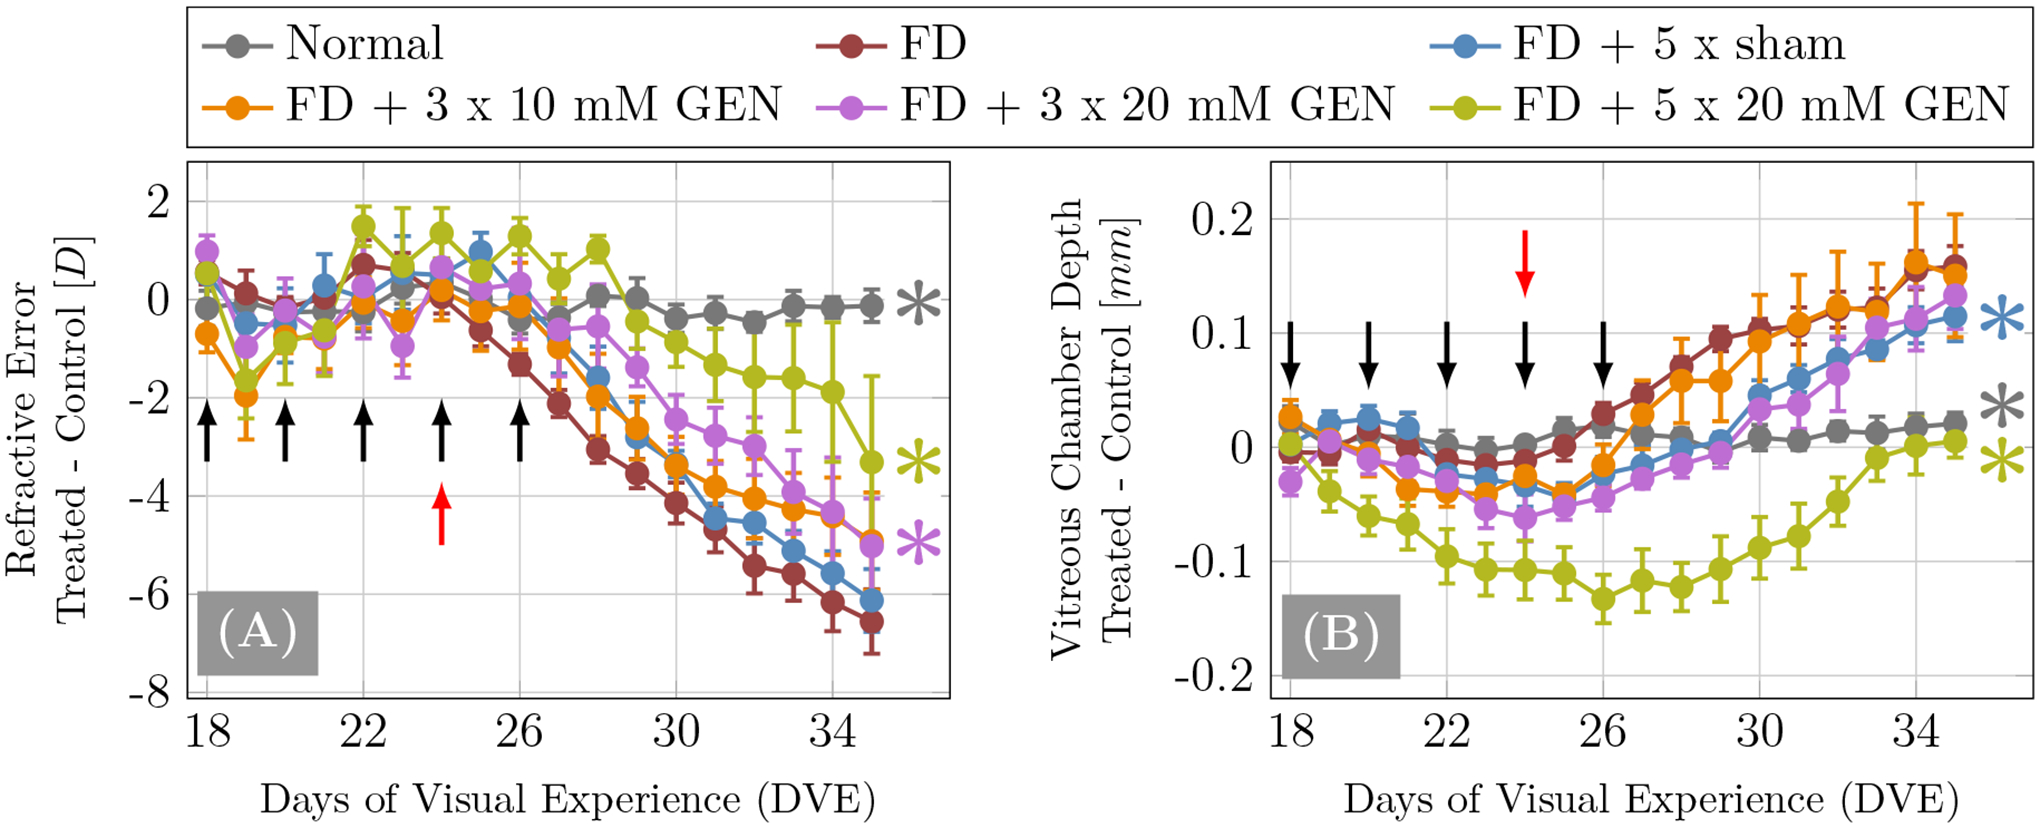
Figure 5:

Plots of daily development of differences between treated and control eye of (A) refractive error and (B) vitreous chamber depth from 18 to 35 DVE. Black arrows indicate the days on which injections were performed while the red arrow indicates the start of form deprivation (FD) treatment. The groups that showed significant differences (p < 0.05, split plot ANOVA) compared to the FD-alone group are marked by a colored asterisk (*) on the right side of each curve.
