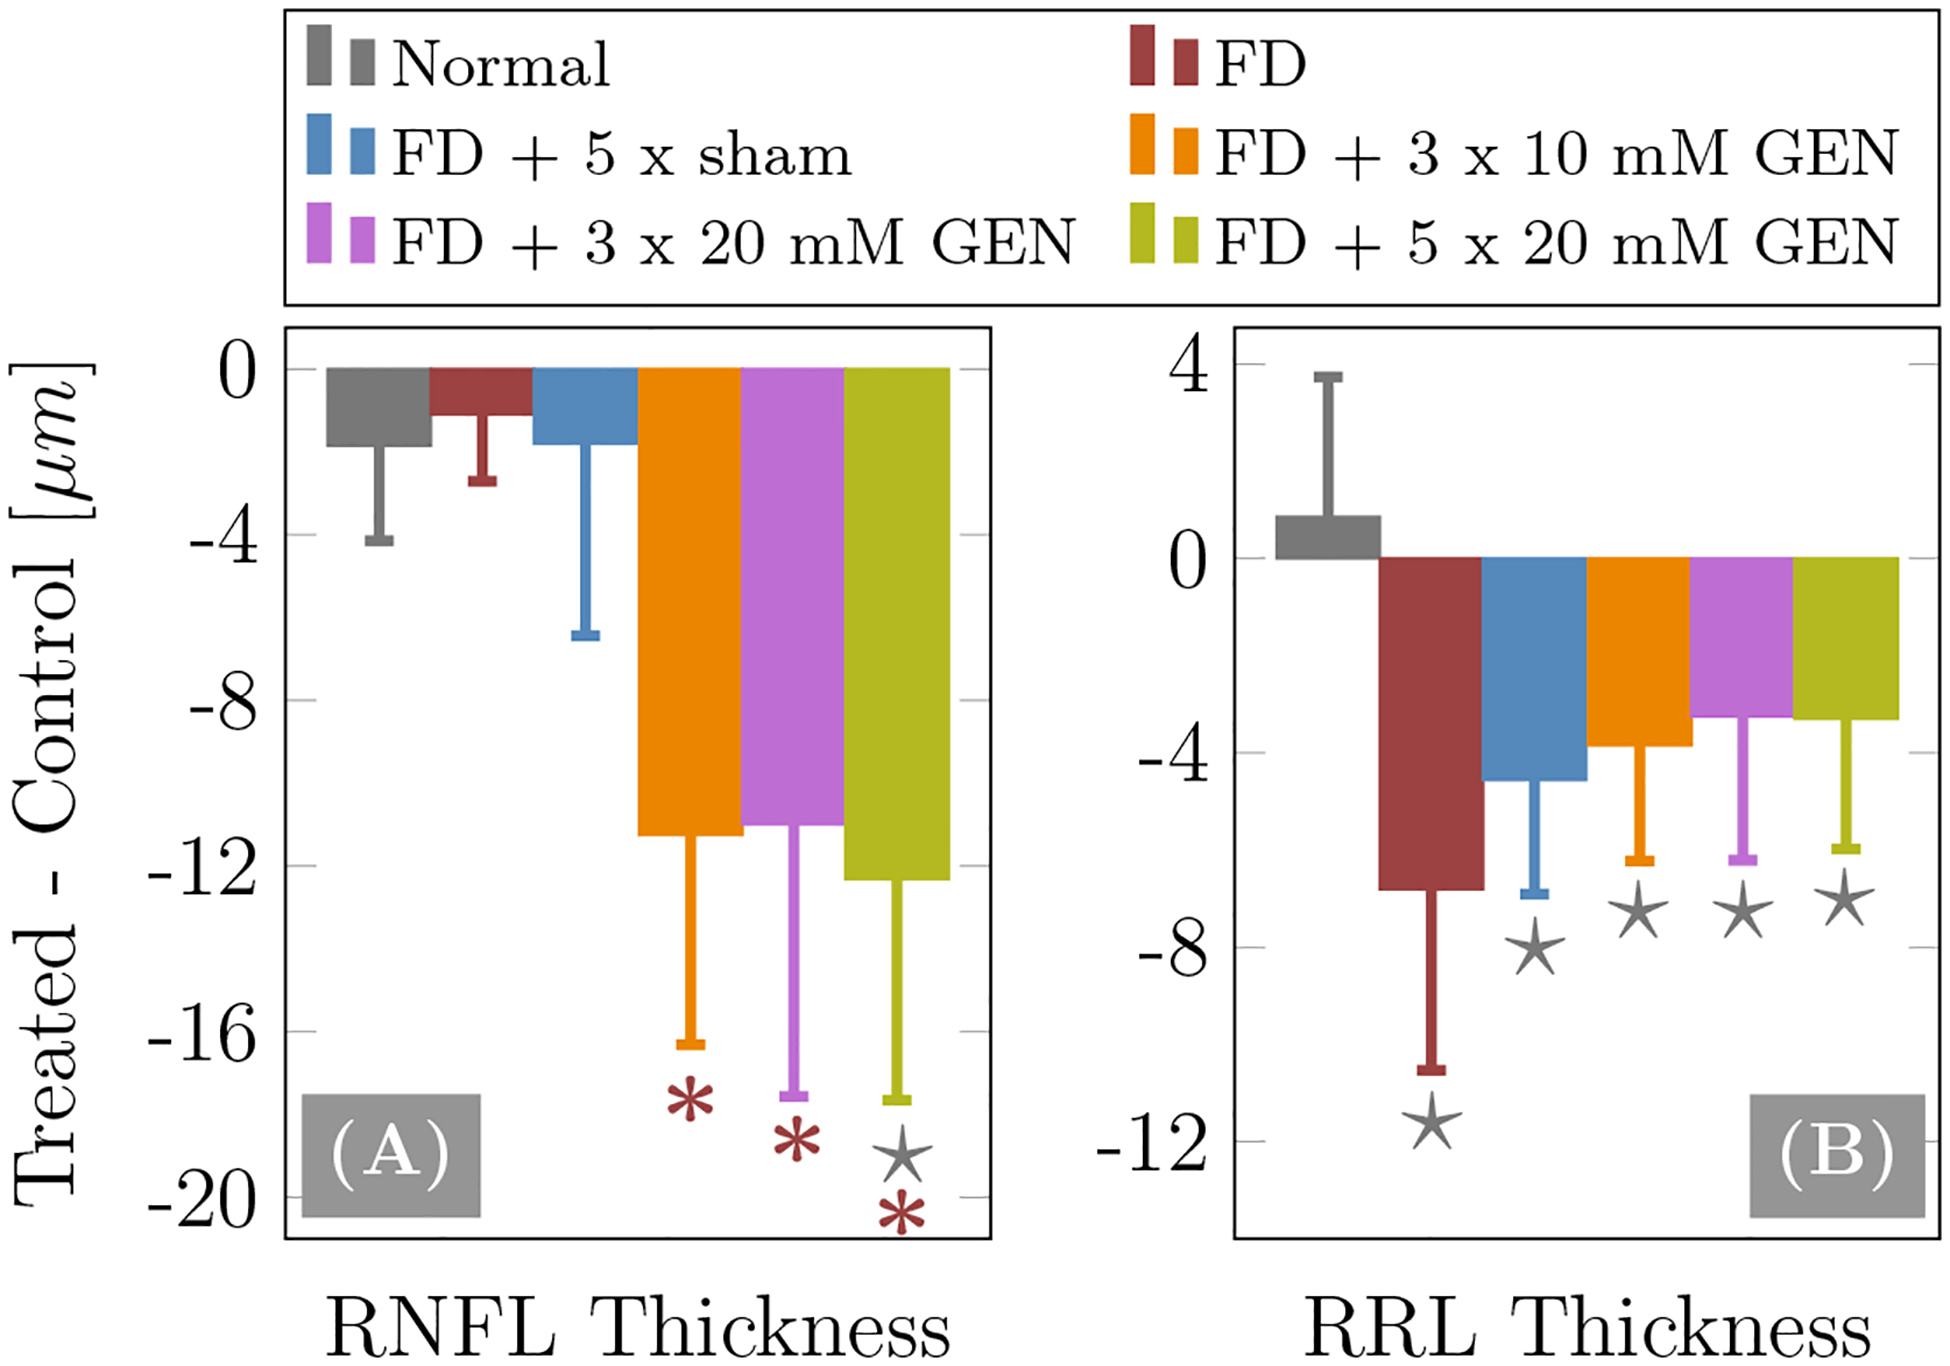
Figure 6:

OCT results of (A) retinal nerve fiber layer (RNFL) thickness and (B) remaining retinal layers (RRL) thickness. Shown are differences between treated and control eyes for injected groups or right and left eyes for the normal group. The error bars represent the standard deviation. The ★ and * represent significant group differences (p < 0.05) with respect to the normal and FD-alone groups, respectively.
