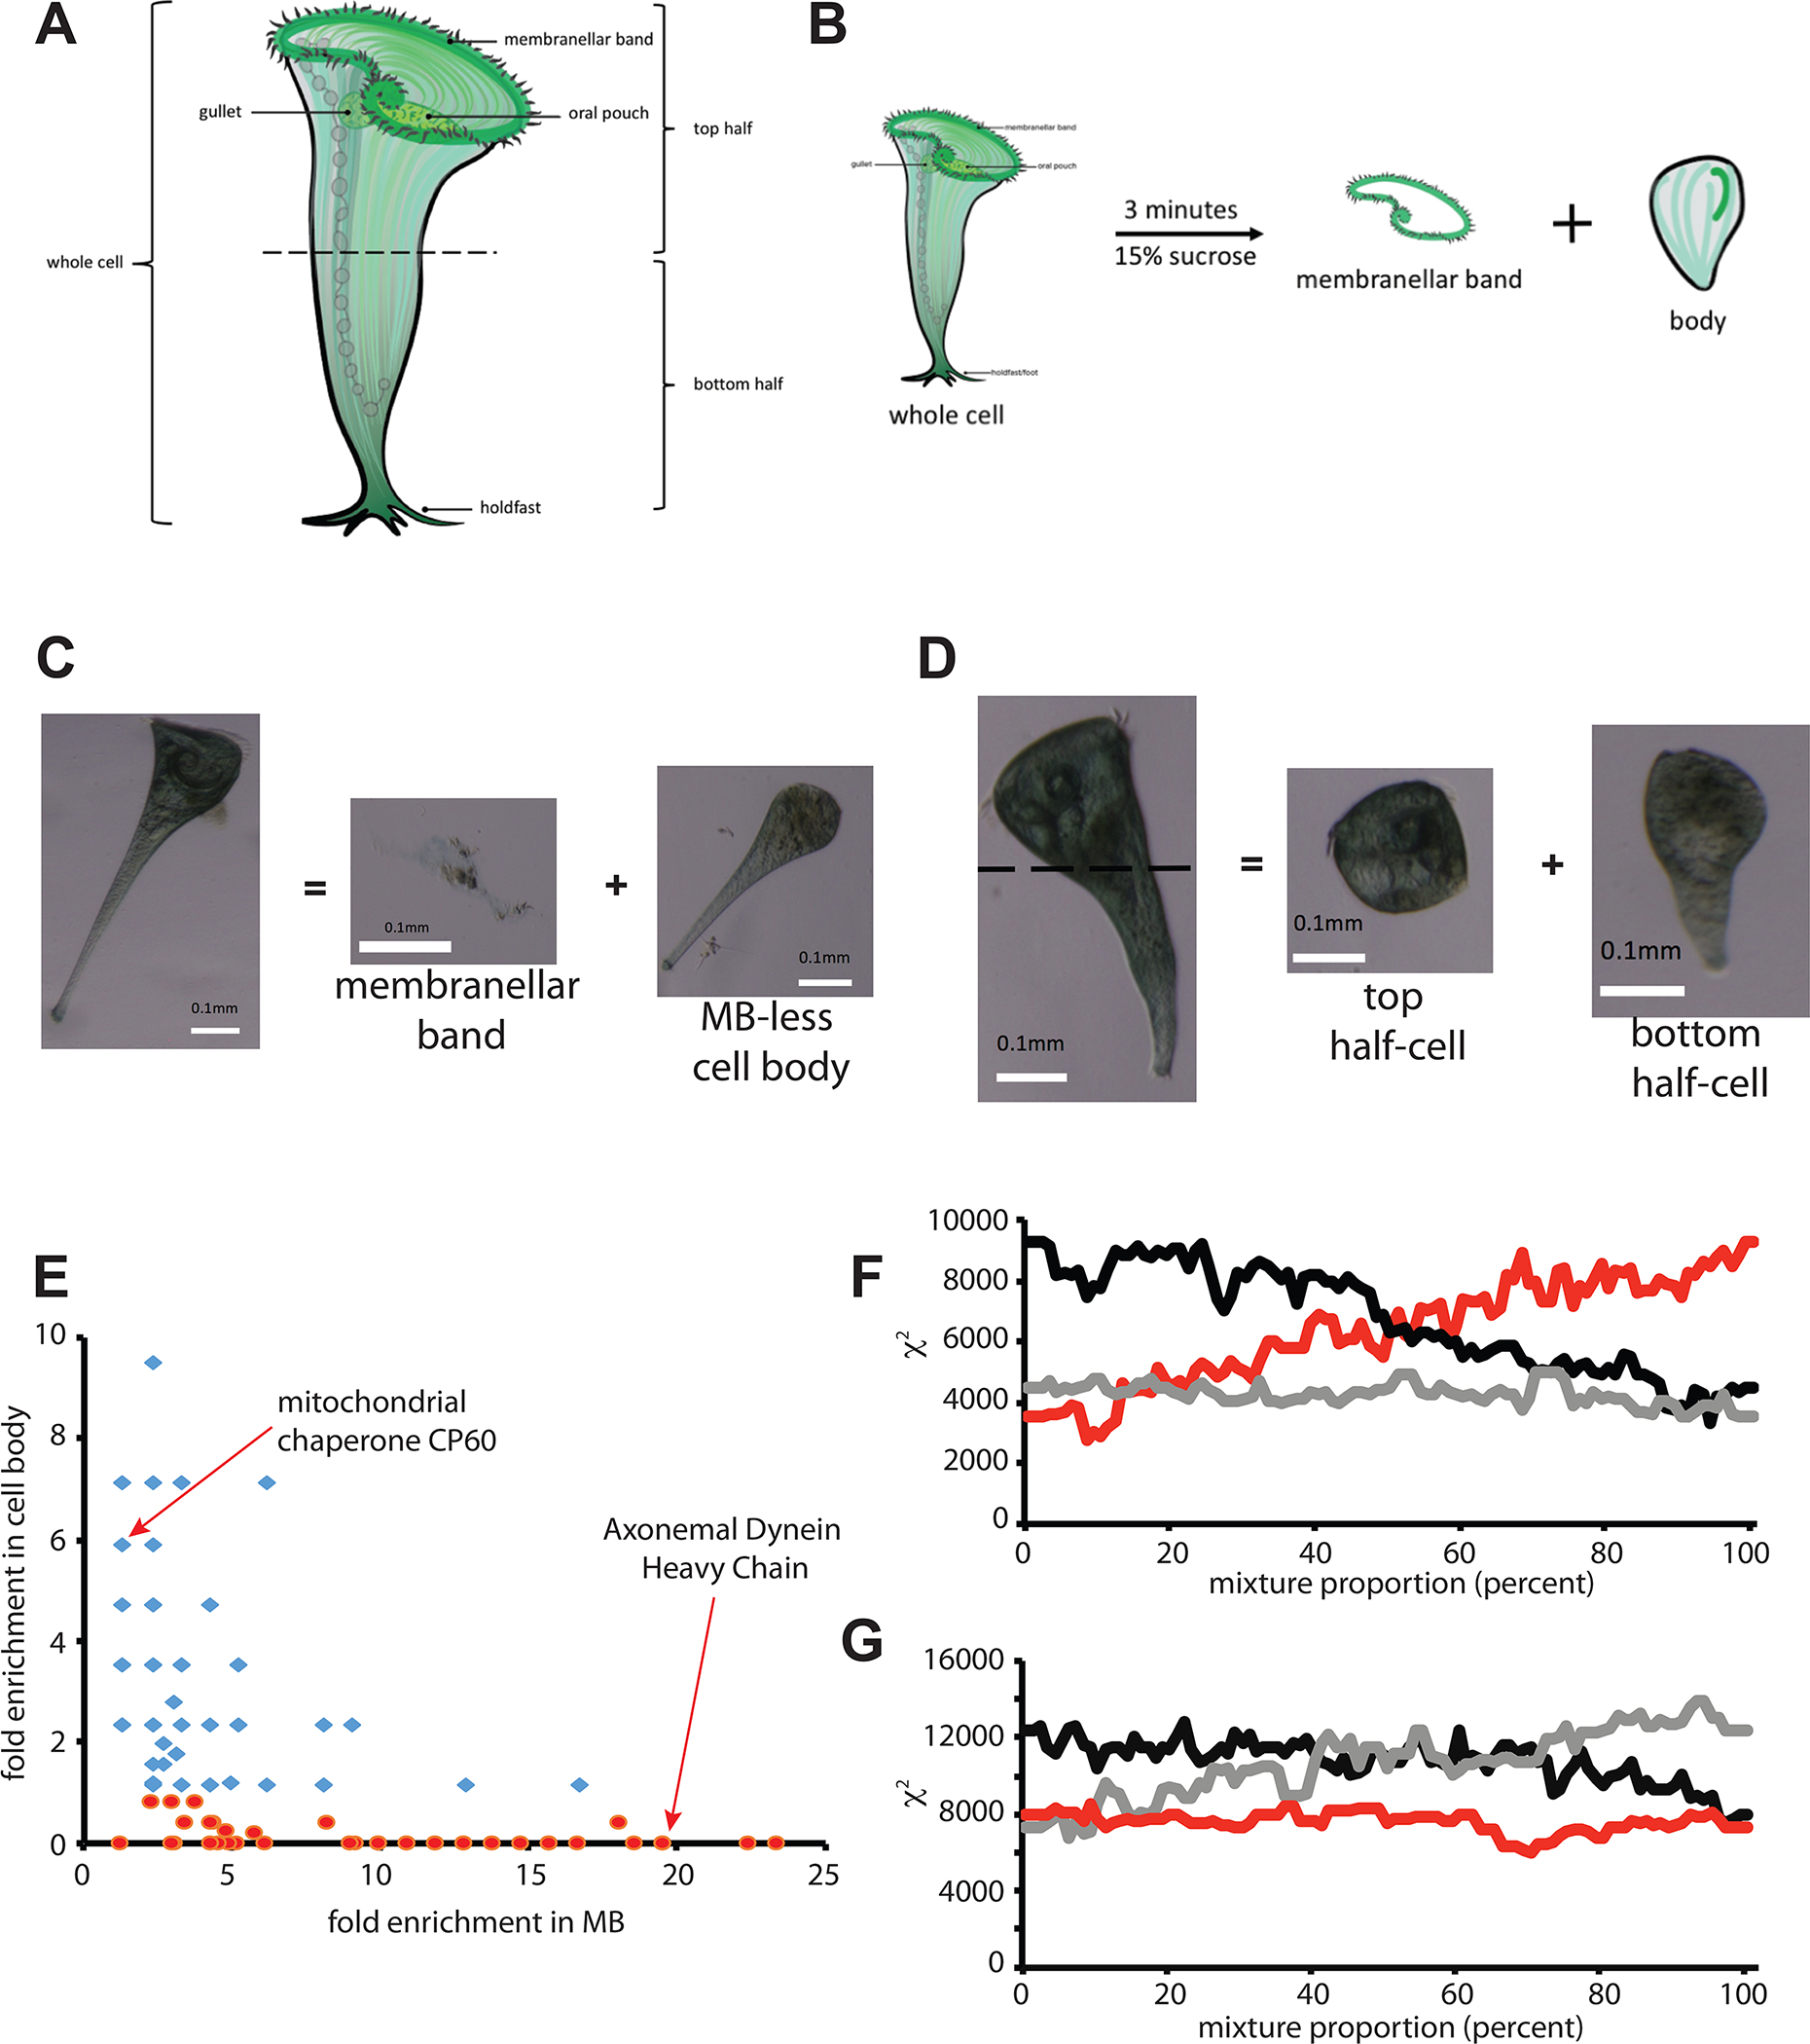
Figure 1.

Proteomic dissection of Stentor. (A) Diagram of Stentor cell showing major anatomical features. (B) Removal of membranellar band (MB) by sucrose shock. (C) Example of a cell before and after sucrose shock, showing detachment of membranellar band and the residual MB-less cell body. (D) Manual dissection of a Stentor cell by cutting with a glass needle to produce anterior and posterior half cells. (E) Correlation between enrichment in MB and depletion from body. Enrichment is reported as fold enrichment in each fraction relative to intact cells, such that a fold enrichment less than 1.0 indicates net depletion in the cell body fraction. Markers represent proteins, with red indicating proteins depleted from the cell body. (F) Dissection Profile analysis of MB removal as described in Methods. (red) mixture model p*bodies + (1-p)*MB = whole cells, plotting chi squared for the mixture compared to whole cells, as a function of fraction p of MB. (black) control mixture model p*MB+(1-p)*whole cells = bodies. (grey) control mixture model p*Whole cells + (1-p)*bodies = MB. (G) Dissection Profile analysis of cell bisection. (red) mixture model p*anterior + (1-p)*posterior = whole cells. (black) control mixture model p*whole cells + (1-p)*anterior = posterior. (grey) control mixture model p*posterior + (1-p)*whole cells = anterior. The identities of proteins detected in our analysis are tabulated in Table S1. Further information relating to this figure is provided in Figure S1 which provides validation of proteomic results using SDS-PAGE analysis of abundant MB proteins.
