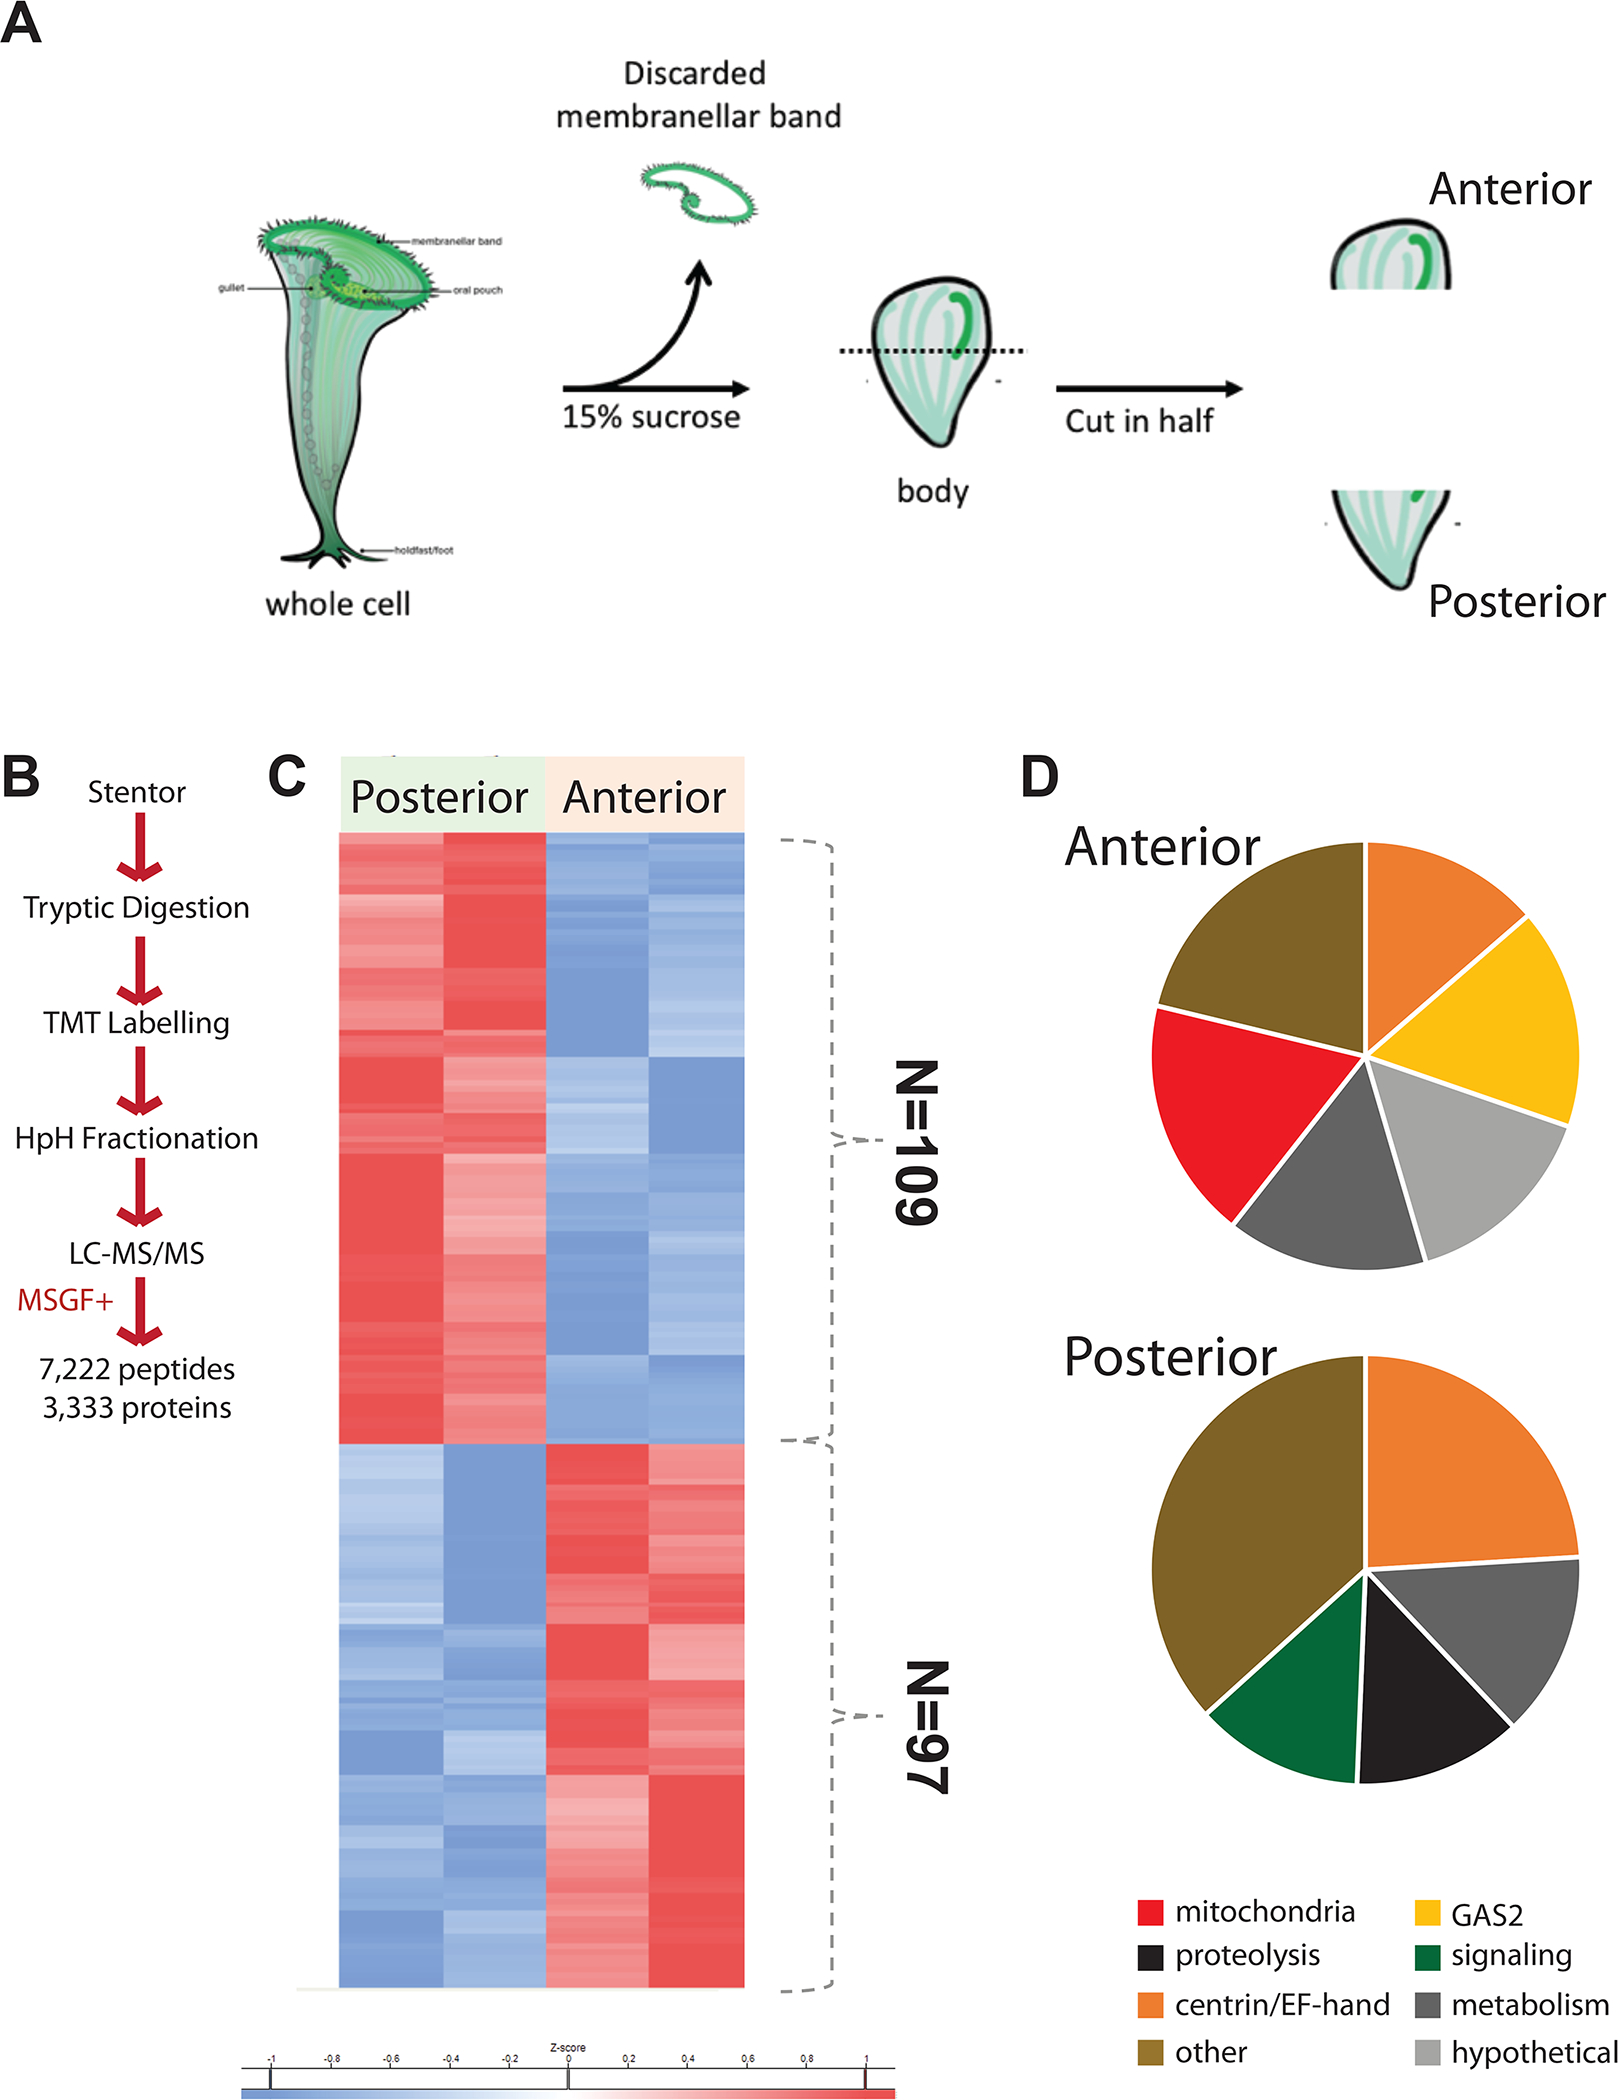
Figure 3.

Proteomic comparison between anterior and posterior cell bodies. (A) In order to prevent MB proteins from dominating the protein comparison, the MB was first removed by sucrose shock, after which the MB-less cell body was cut in half. (B) Proteomic flow chart for differential comparison of cell body halves. TMT refers to tandem mass tagging the peptides by reacting them with isobaric tags. MSGF+ refers to computational search and identification of isobaric tagged peptides using the MS-GF+ software. (C) Cluster diagram showing proteins enriched in the anterior and posterior halves of the cell body. Proteins depicted in this heatmap are listed in Table S2. (D) Charts showing the classes of proteins most differentially expressed in the two halves of the cell body.
