Figure 4.

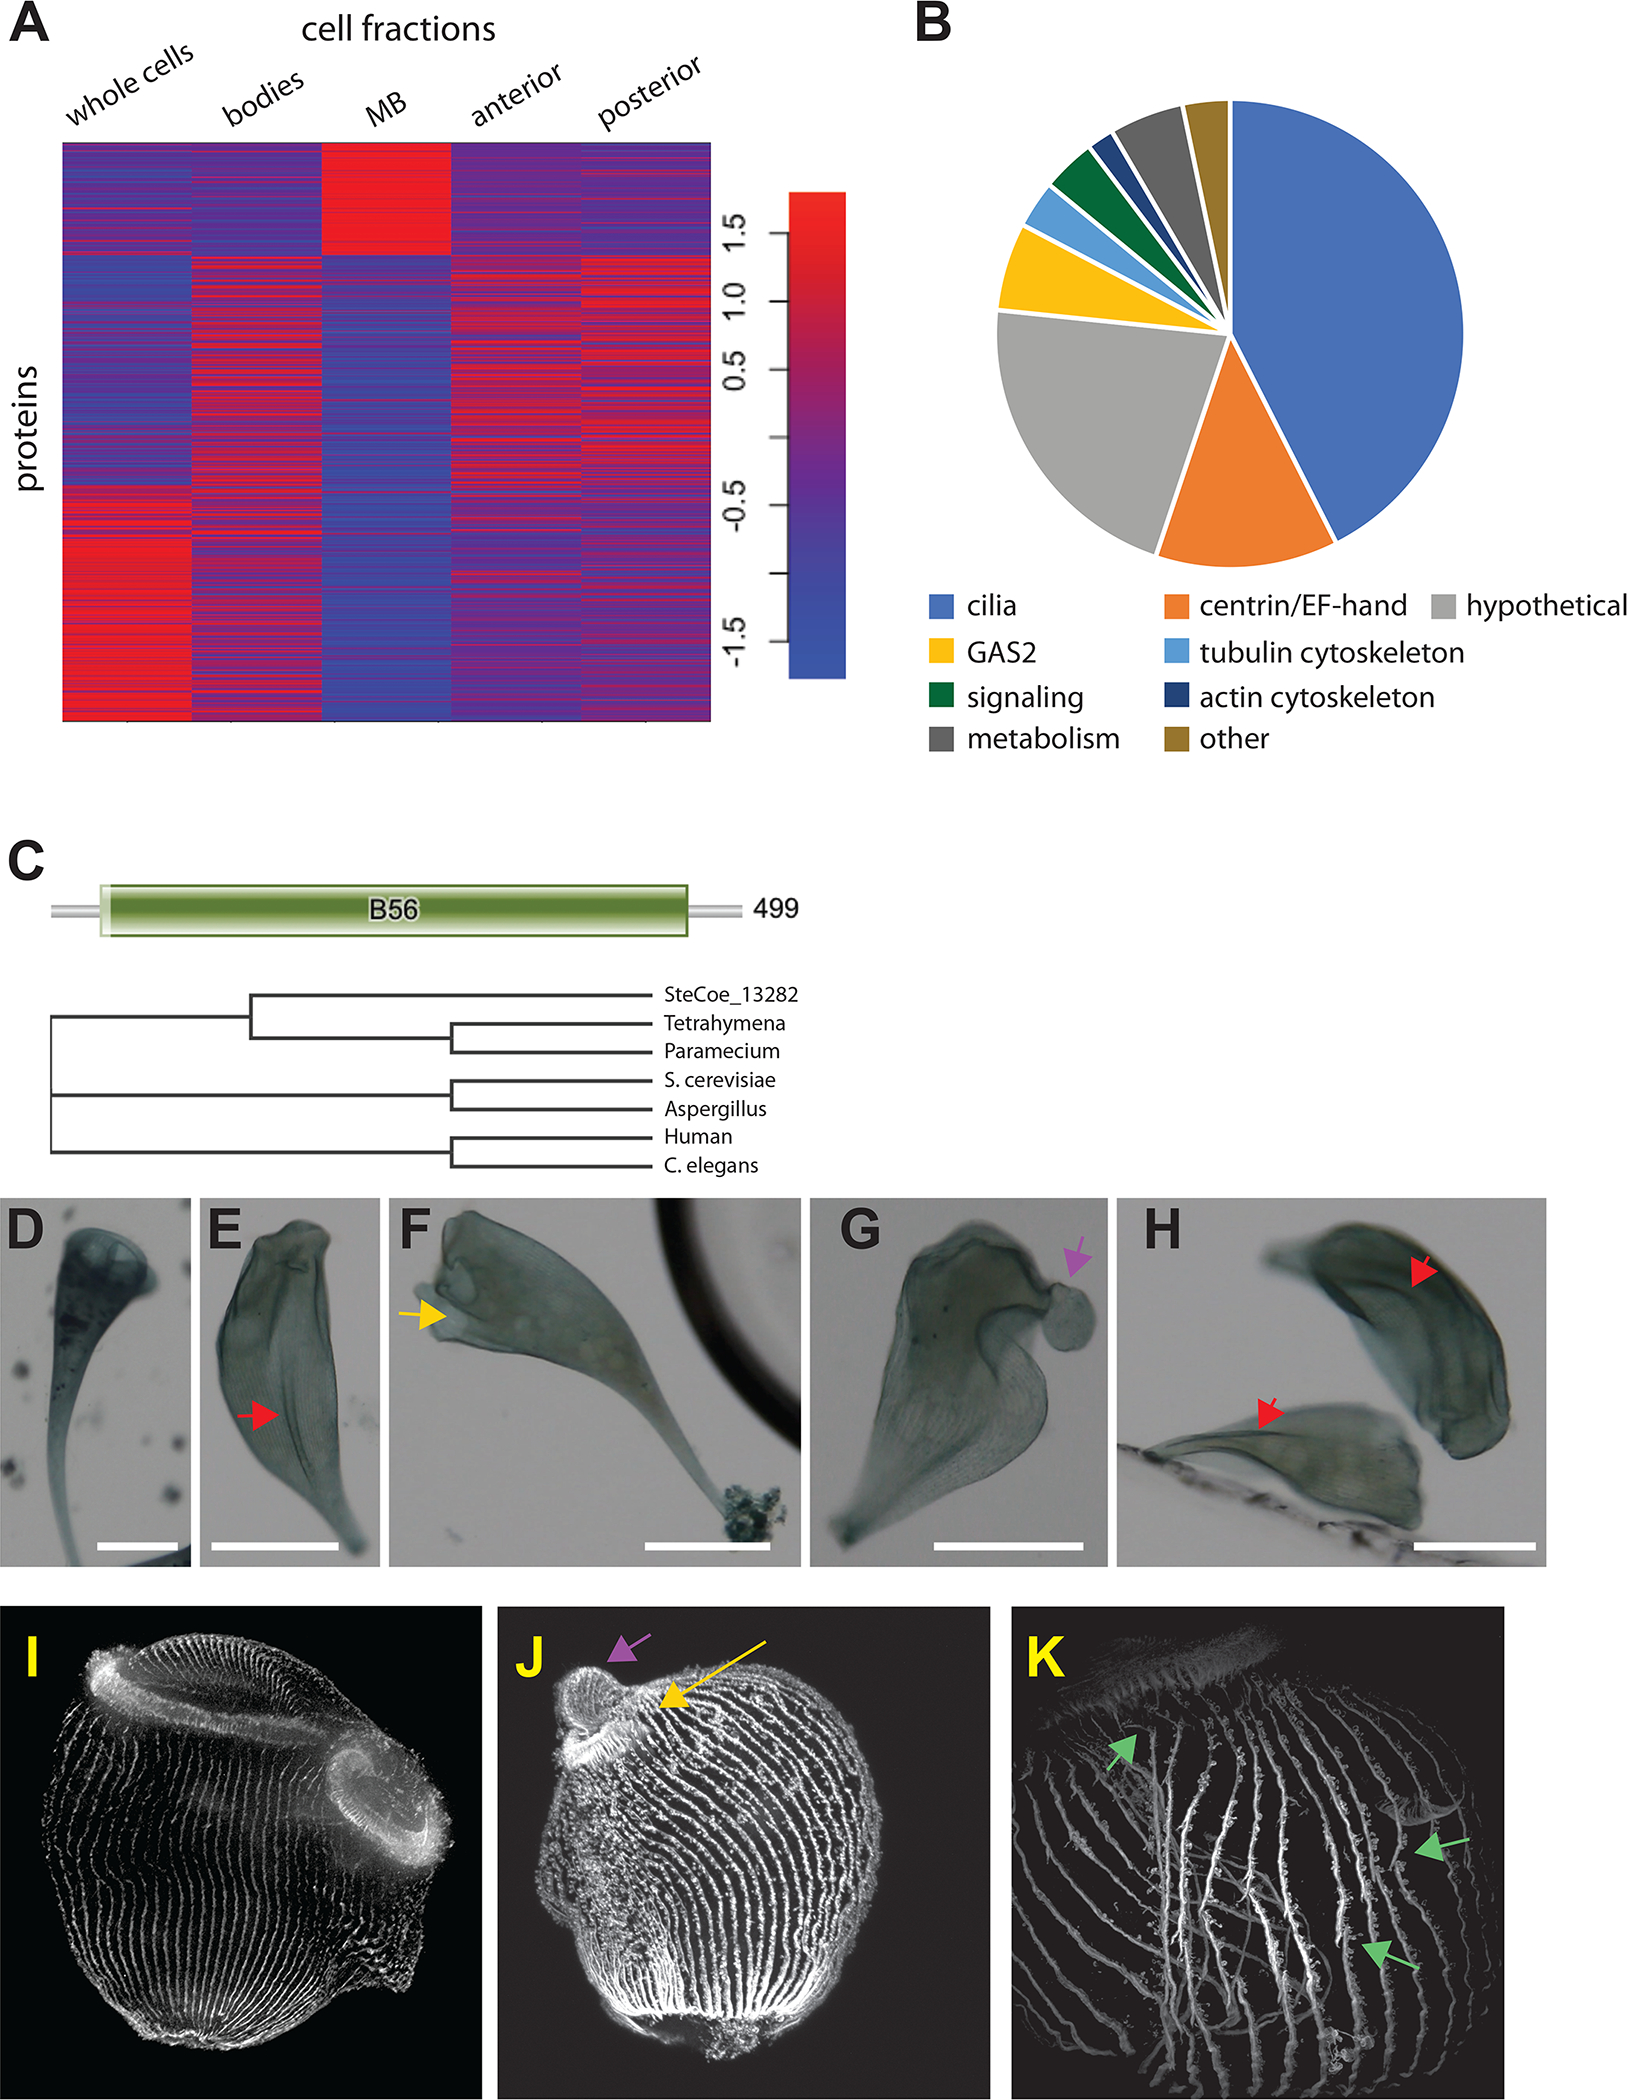
Proteome of the membranellar band. (A) K-means cluster analysis of abundant proteins across all five cell fragments. Cluster 1 identifies MB enriched proteins. Red indicates increased weighting in the profile. Colors indicate Z scores of normalized, median centered data for each row. Statistical support for the use of three clusters is provided in Figure S3. (B) Protein families contained in the MB enriched dataset (Table S4) obtained by merging cluster 1 of panel A with the statistically enriched MB proteins identified in Figure 2B that also had RNAseq support as described in the text. (C) Signaling proteins of the MB include a putative PP2A B59 subunit b ortholog encoded by gene SteCoe_13282. Bar diagram shows result of PFAM domain analysis, indicating that the majority of the protein is a B59 domain characteristic of the PP2a regulatory subunit b. Phylogenetic tree is a cladogram of a Clustal multiple alignment between the stentor PP2a subunit b ortholog and PP2a subunit b from ciliate, fungal, and animal species, showing a clear grouping with the ciliate orthologs. (D-H) RNAi of SteCoe_13282. Scale bar 200 μm in all panels. (D) negative control showing the normal cone-like shape of a Stentor cell with a circular membranellar band at the anterior end. (E-H) Examples of RNAi cells imaged after 9 days of RNAi by feeding. (E) Cell lacking a closed MB and having abnormal folds or creases on the cell surface (red arrow). (F) Cell in which an MB is present but where the ends do not meet up to produce a closed structure (yellow arrow). (G) Cell lacking a closed MB, in which the frontal field (the region of cortex normally contained inside the MB) is protruding from the cell (purple arrow). (H) Additional cells lacking a normal closed MB and with longitudinal folds on the cell surface (red arrows). (I-K) Immunofluorescence of cortical microtubule structures in PP2A RNAi. (I) Negative control illustrating normal cell morphology with parallel unbroken rows and a densely staining membranellar band. The membranellar band curves around behind the cell. The point where the two ends of the membranellar band meet is visible in front, and it can be seen that microtubule rows from the cell body do not intrude between the two ends of the membranellar band (J) RNAi cell showing a small MB with an opening on one side (yellow arrow) and a protruding frontal field (purple arrow). In contrast to control cells, microtubule bundles from the cell body have inserted into the gap between the two ends of the membranellar band. (K) Higher magnification view of cortical rows in an RNAi cell showing regions in which the cortical rows fail to maintain integrity (green arrows). Further information about the PP2a phenotype is provided in Figure S4 which presents results of chemical inhibitors as well as time-course information for development of the RNAi phenotype.
