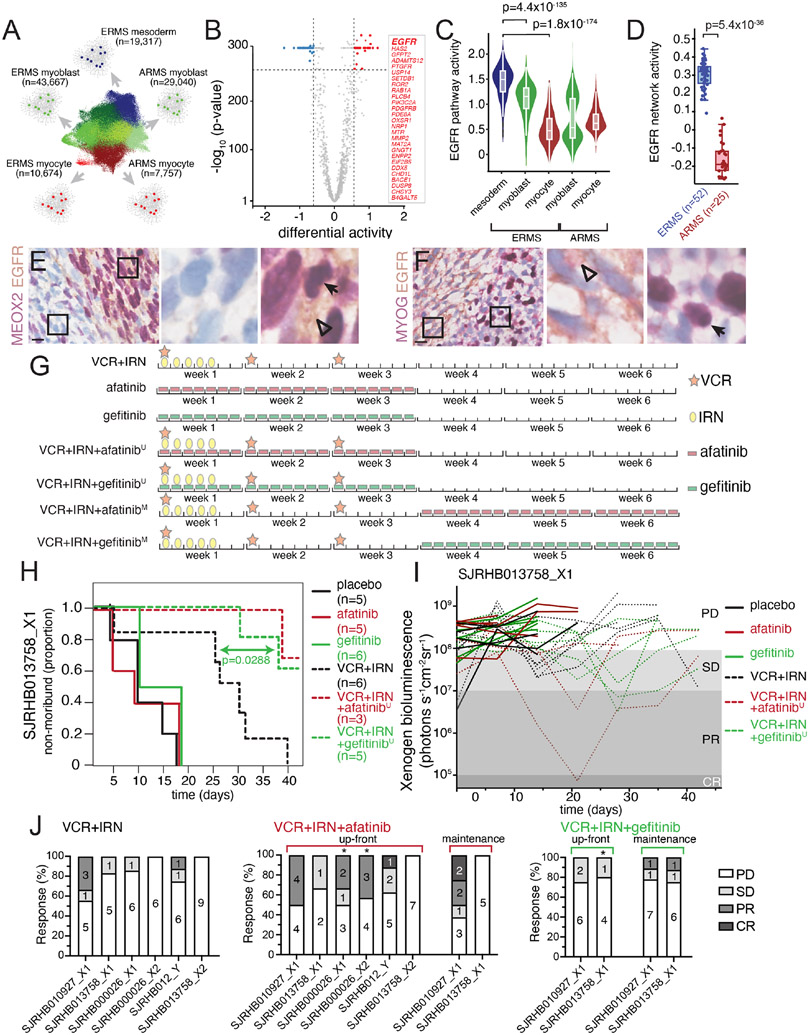
Figure 6. Mesoderm-like ERMS cells are uniquely vulnerable to EGFR blockade.
A, Schematic workflow of NetBID algorithm to identify cell type-specific drivers from snRNA-seq data. B, Volcano plot of differential activity analysis of signaling drivers in ERMSmesoderm vs. other cell types. C-D, EGFR NetBID activity in different developmental states from snRNA-seq data (C) and inferred from bulk RNA-seq of patient tumors (D). E-F, Dual IHC staining of ERMS patient tumor, SJRHB030680_R1, combining EGFR (brown) with either MEOX2 (E) or MYOG (F) in purple. G, Schedules of drugs used for preclinical study. Mice were randomized into one of eight arms): placebo, gefitinib daily for 3 weeks, afatinib daily for 3 weeks, VCR+IRN, VCR+IRN+‘up-front’ afatinib (afatinibU), VCR+IRN+‘up-front’ gefitinib (gefitinibU), VCR+IRN+‘maintenance’ afatinib (afatinibM), or VCR+IRN+‘maintenance’ gefitinib (gefitinibM). In up-front arms (‘U’), mice received VCR+IRN while also receiving daily EGFRi. In maintenance arms (‘M’), mice received 3 weeks of VCR+IRN followed by 3 additional weeks of daily EGFRi. H, Survival curves for each treatment group for a ERMS tumor O-PDX (SJRHB013758_X1). I, Tumor response of SJRHB013758_X1 during preclinical testing. Outcomes were defined based on Xenogen signal at the end of therapy: progressive disease (PD, signal > 108); stable disease (SD, 107 < signal < 108); partial response (PR, 105 signal < 107); complete response (CR, signal < 105). J, Percent response for the six O-PDX models treated with VCR+IRN (left), VCR+IRN+afatinib (center) or VCR+IRN+gefitinib (right). Asterisks denote models that significant difference in tumor progression compared to VCR+IRN. Scale bars: E,F, 10 μm. Abbreviations: VCR, vincristine; IRN, irinotecan; ERMS, embryonal rhabdomyosarcoma; ARMS, alveolar rhabdomyosarcoma.

