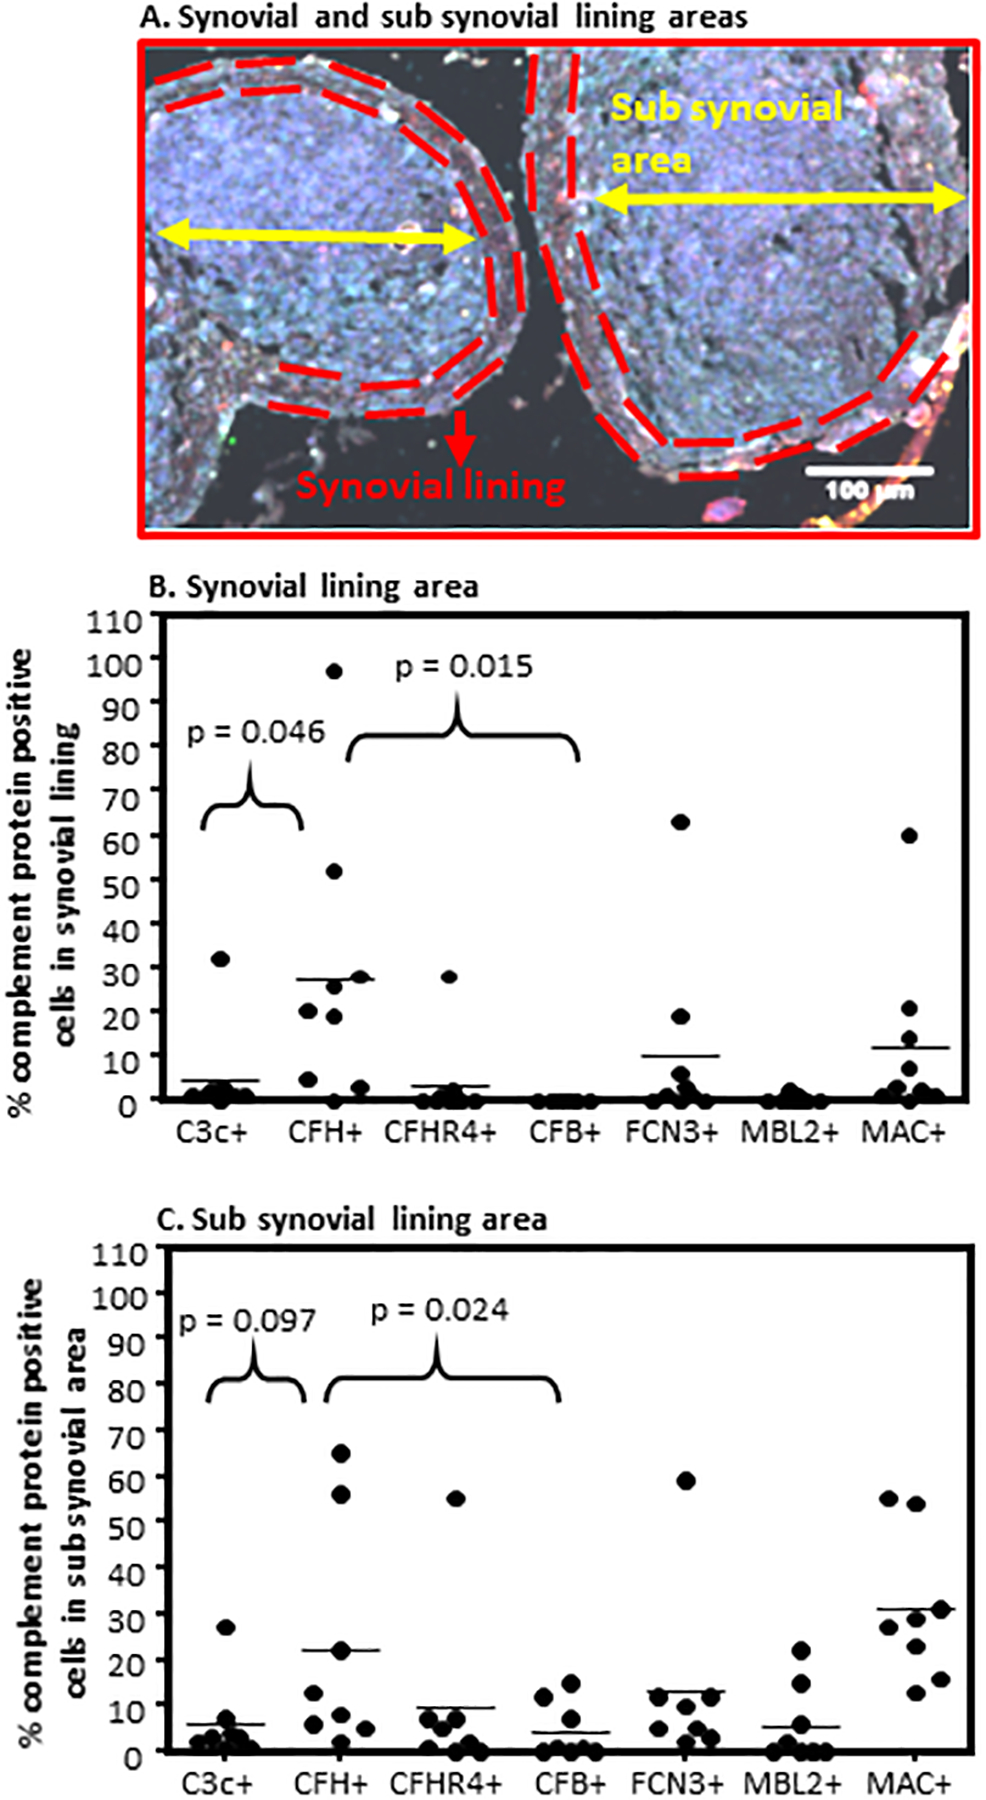
Figure 8.

Quantitative complement protein analysis of the synovial and sub-synovial lining areas of Early RA biopsies using an algorithm on composite images generated by MIHC. A. A representative composite image of Early RA synovial biopsy showing boundaries of the synovial lining (dashed red line) and sub-synovial lining (yellow arrow) areas. B. Percent complement protein expressing cells in the synovial lining area (2–4 cell layers thick). C. Percent complement protein expressing cells in the sub synovial lining area (below synovial membrane containing immune and infiltrating immune cells). Total number of Early RA biopsies used to quantitate synovial lining area (n = 9) and sub synovial lining area (n = 10). This analysis was repeated from ten Early RA synovial biopsies with intact synovial membrane. *p < 0.05 considered significant. Scale bar = 100μm
