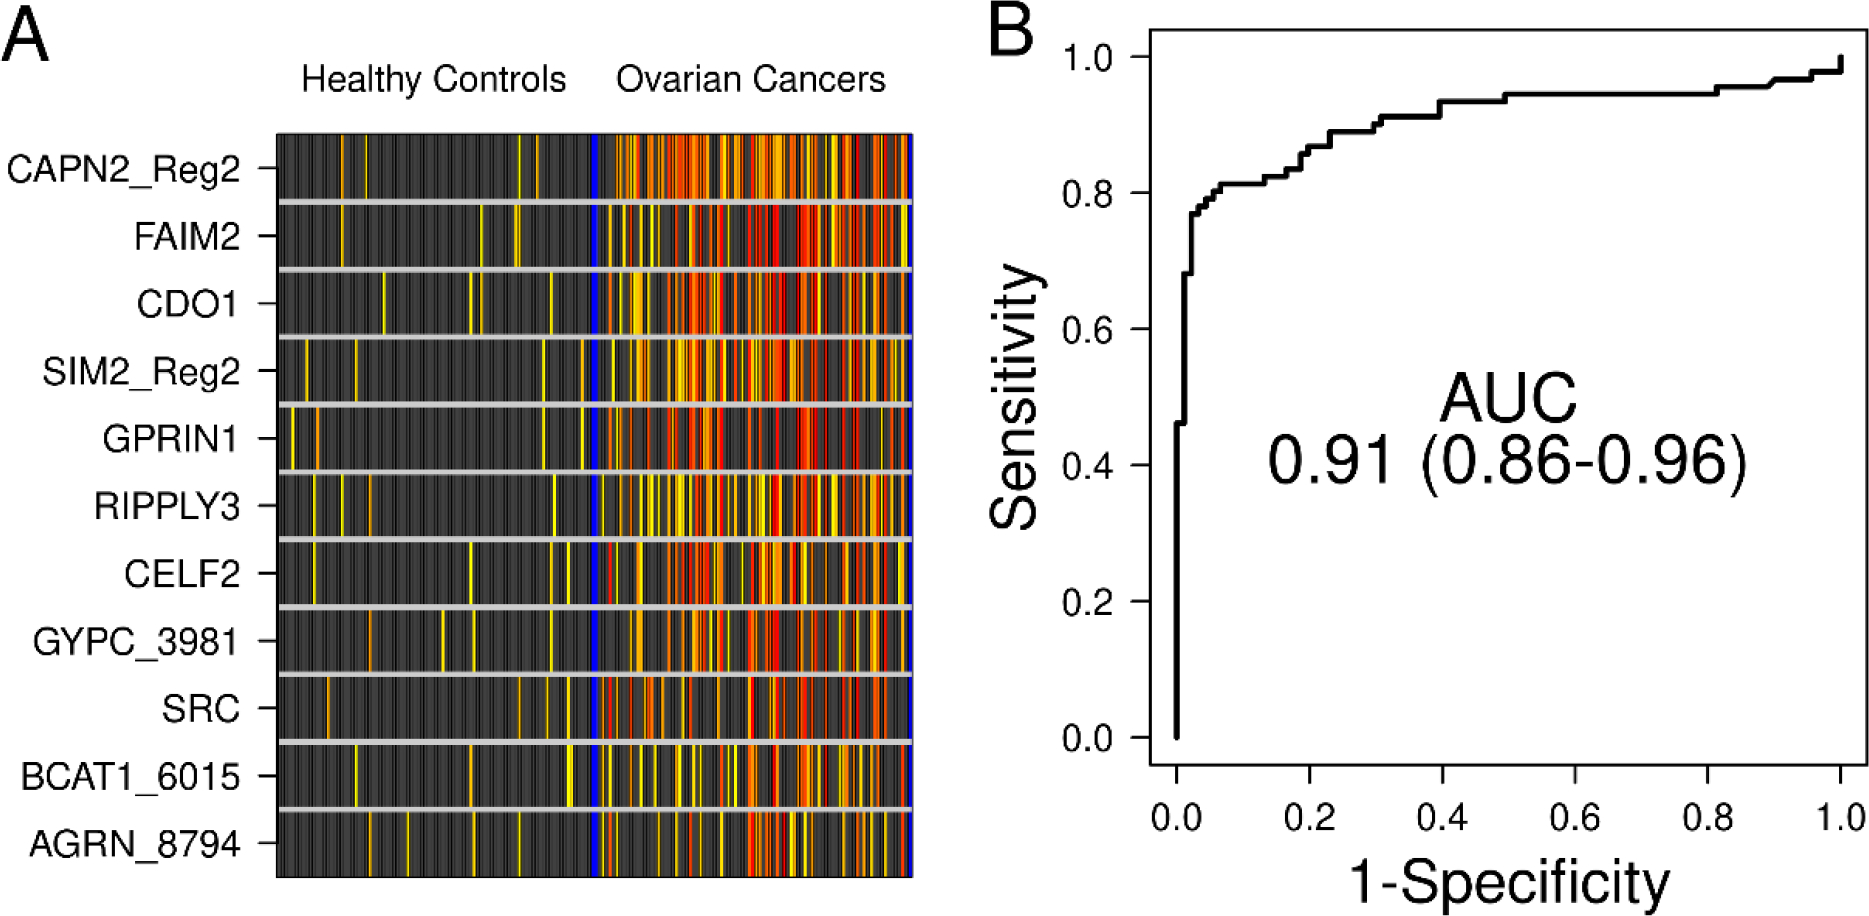
Figure 3.

A. Methylation intensity of top 11 OC MDMs in plasma within the plasma-based clinical pilot. Black boxes indicate values of B3GALT6-normalized MDM qMSP product below the control samples’ 95th percentile. For products above that threshold, increasing deciles of intensity are depicted on a yellow-red color spectrum. Each row is a candidate MDM, each column is a patient sample. B. In plasma, the 11-MDM panel discriminated between OC cases and healthy controls with an AUC of 0.91.
