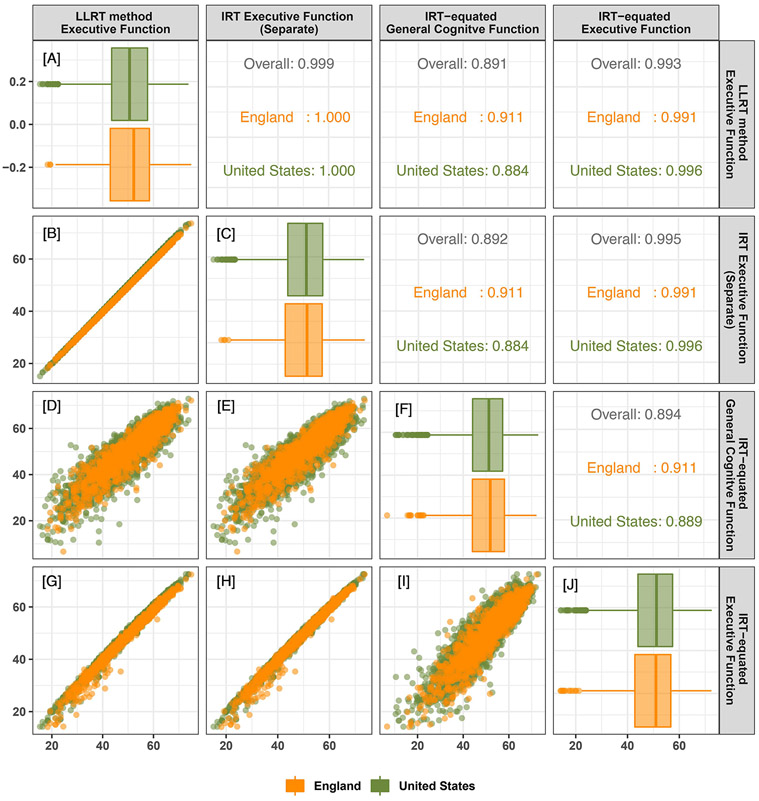
Figure 4.
Correlation matrix for the correspondence between the distributions of IRT-equated executive functioning scores, IRT-equated general cognitive functioning scores, independent scores of executive functioning, and LLRT-equated scores of executive functioning for individuals in the United States and England HCAP samples. The plots in the lower diagonal compare the distributions via scatterplots, while the upper diagonal displays corresponding Pearson correlation coefficients, both overall and stratified by sample. The plots on the diagonal show sample differences for each score examined.

