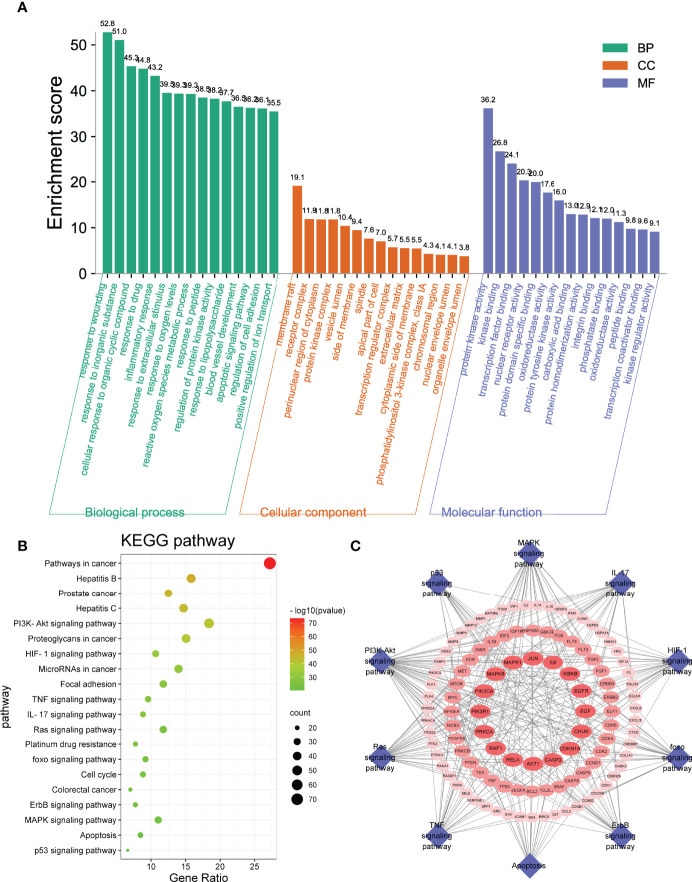
Figure 3.
Gene Ontology and Kyoto Encyclopedia of Genes and Genomes enrichment analyses. (A) The GO analysis includes the top 15 terms in biological process, cellular component, and molecular function. (B) Top 20 enriched pathways of common targets. The color scales mean the different thresholds of adjusted p-values, and the sizes of the dots indicate the gene counts of each term. (C) Target–pathway network. The blue diamonds represent the pathways, and the red ellipses represent the targets.

