Figure 5.
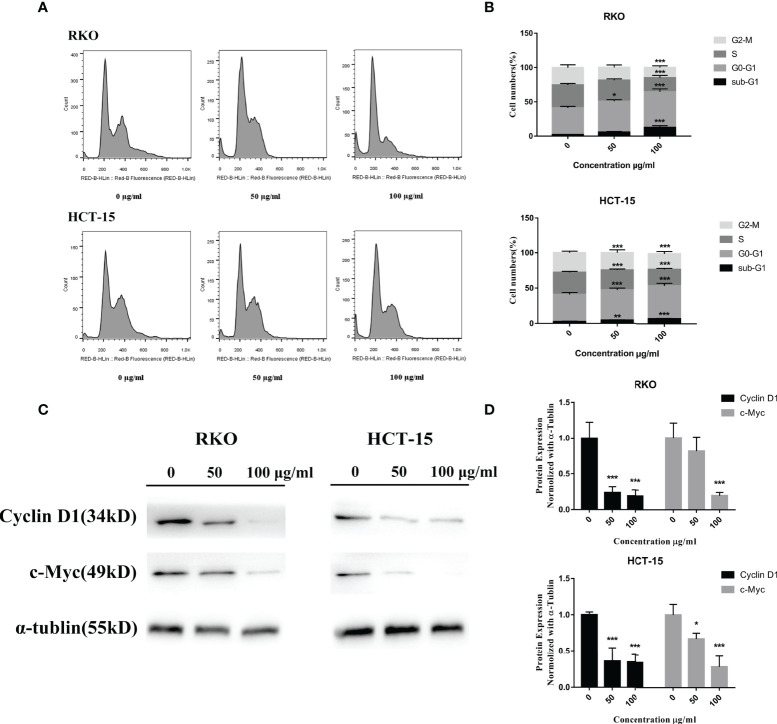
S. officinalis arrested the cell cycle at G0–G1 phase. (A) The cells were stained by propidium iodide and RNase after 24 h of S. officinalis treatment, and the DNA contents were then measured by flow cytometry. (B) The histogram shows the percentage of cell numbers in cell cycle phases in the treatment and control groups. The results are expressed as mean ± SD (n = 3). *p < 0.05, **p < 0.01, ***p < 0.001, compared with the control group. (C) Following the treatment with S. officinalis for 24 h, the expression levels of cyclin D1 and c-Myc proteins were determined by western blot and analyzed by α-tubulin. (D) The histogram shows the protein expression level in the treatment and control groups. The results are expressed as mean ± SD (n = 3). *p < 0.05, **p < 0.01, ***p < 0.001, compared with the control group.

