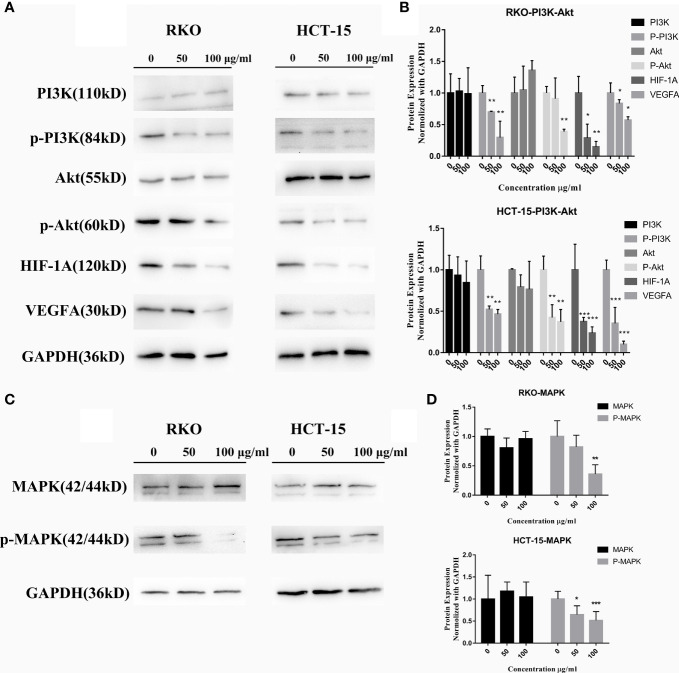
Figure 8.
S. officinalis suppresses the pathways related to cell proliferation and migration. (A) The expression of PI3K, p-PI3K, Akt, p-Akt, HIF-1A, and VEGFA proteins in RKO and HCT-15 cells after S. officinalis treatment for 24 h. (B) The histogram shows the protein expression level normalized with GAPDH in the treatment and control groups. The results are expressed as mean ± SD (n = 3). *p < 0.05, **p < 0.01, ***p < 0.001, compared with the control group. (C) Expression of MAPK (p44 and p42) and p-MAPK proteins. (D) The histogram shows the protein expression normalized with GAPDH in the treatment and control groups. The results are expressed as mean ± SD (n = 3). *p < 0.05, **p < 0.01, ***p < 0.001, compared with the control group.

