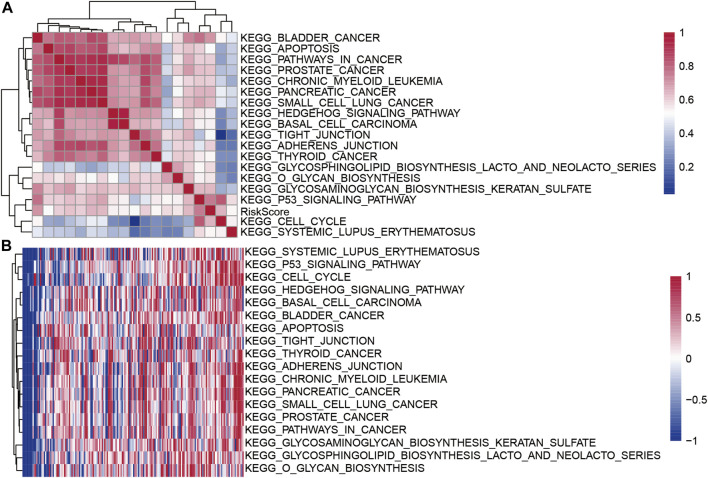
FIGURE 9.
(A) Clustering correlation coefficients for KEGG pathways and RiskScores >0.5; (B) For KEGG pathways with risk score correlations >0.5, the change in the relationship of ssGSEA score for each sample with the increase in risk score was calculated. The horizontal axis represents the sample, and the risk score increases from left to right.

