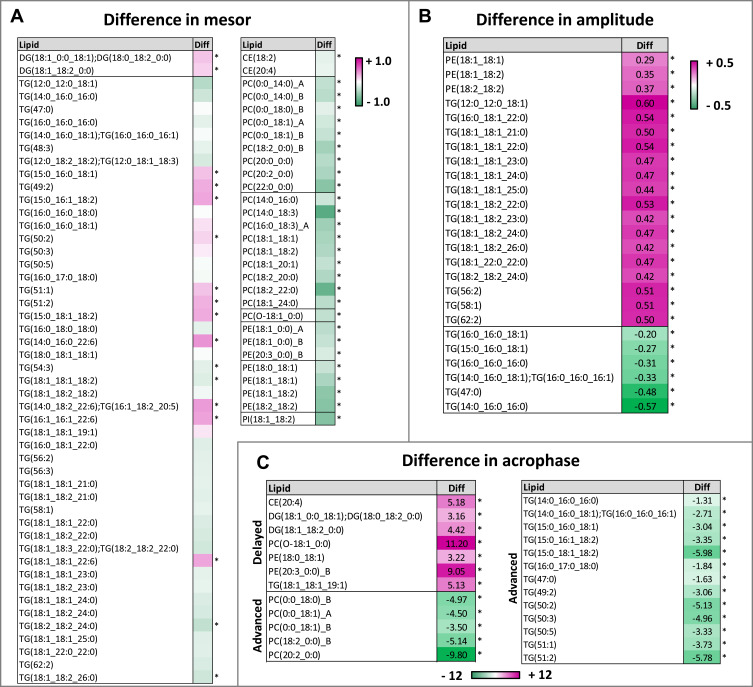
Figure 4.
Changes in circadian rhythmicity in the plasma lipidome due to a simulated night-shift schedule. (A) Difference in mesor after night-shift compared to day-shift by lipid. Within each subclass, lipids are organized by increasing number of total chain carbons, then by double bonds. Lipids that have greater mean abundance after the night-shift compared to the day-shift are color coded pink, and lipids that have less mean abundance after the night-shift are color coded green. Asterisks indicate statistical significance (p<0.05). Diff = difference as night-shift minus night-shift day-shift. Scale bar, pink = +1, white = 0, green = −1, with values representing difference in log2 normalized abundances. (B) Statistically significant (p<0.05) difference in amplitude after night-shift compared to day-shift by lipid. Lipids that are more rhythmic have a higher value of the difference (Diff) value, where Diff = difference as night-shift minus day-shift. Color scale, pink = more rhythmic after night-shift, green = less rhythmic after night-shift, with values representing difference in log2 normalized abundances. (C) Lipids that were significantly phase advanced or delayed after simulated night-shift compared to simulated day-shift. TGs containing an odd chained fatty acid almost exclusively advanced.
Abbreviations: CE, cholesterol ester; DG, diacylglyceride; PC, glycerophosphocholine (mono- and di-acyl; O-ether linked); PE, glycerophosphoethanolamine (mono- and di-acyl); PI, diacylglycerophosphoinositol; TG, triacylglyceride.

