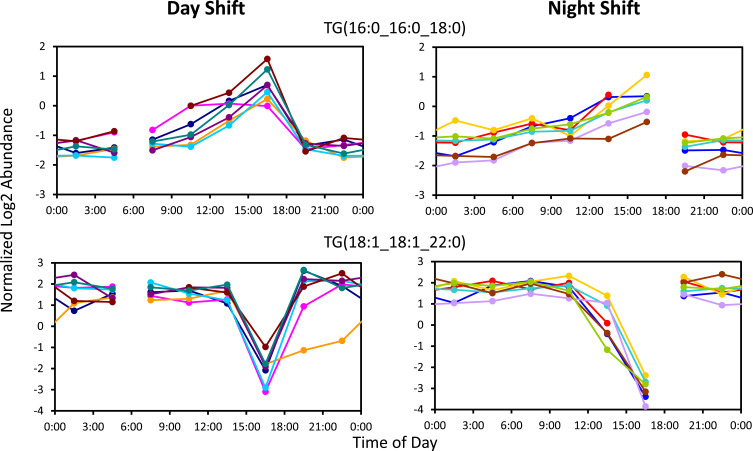
Figure 5.
Example time series of TGs that peaked or dipped at 16:30 h regardless of shift condition. Plots on the left are from the day-shift, and plots on the right are from the night-shift. Each curve corresponds to an individual’s data plotted against clock time. TGs that were elevated at 16:30 h consisted of saturated fatty acids, 16:0 in particular (top). TGs that were depleted at 16:30 h tended to contain VLCFAs and 18:1 (bottom). Break in curve indicates where the constant routine began/ended.

