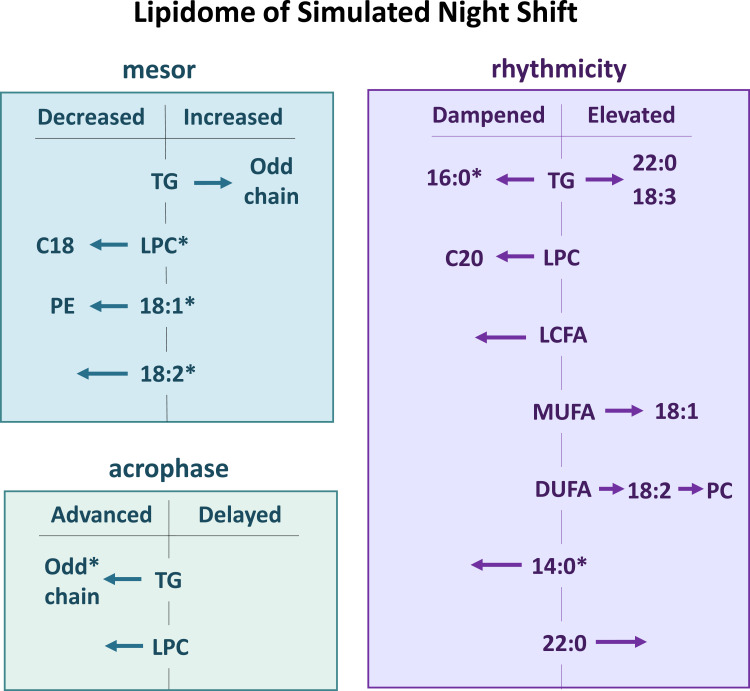
Figure 6.
Summary of changes in the endogenous circadian profiles of the lipidome induced by a simulated night-shift schedule. The arrows indicate direction of change for specific lipids, with additional specificity noted at the end of the arrow, if applicable. Asterisks (*) indicate lipid changes consistent with CVD and/or CVD risk.

