
Figure 8.
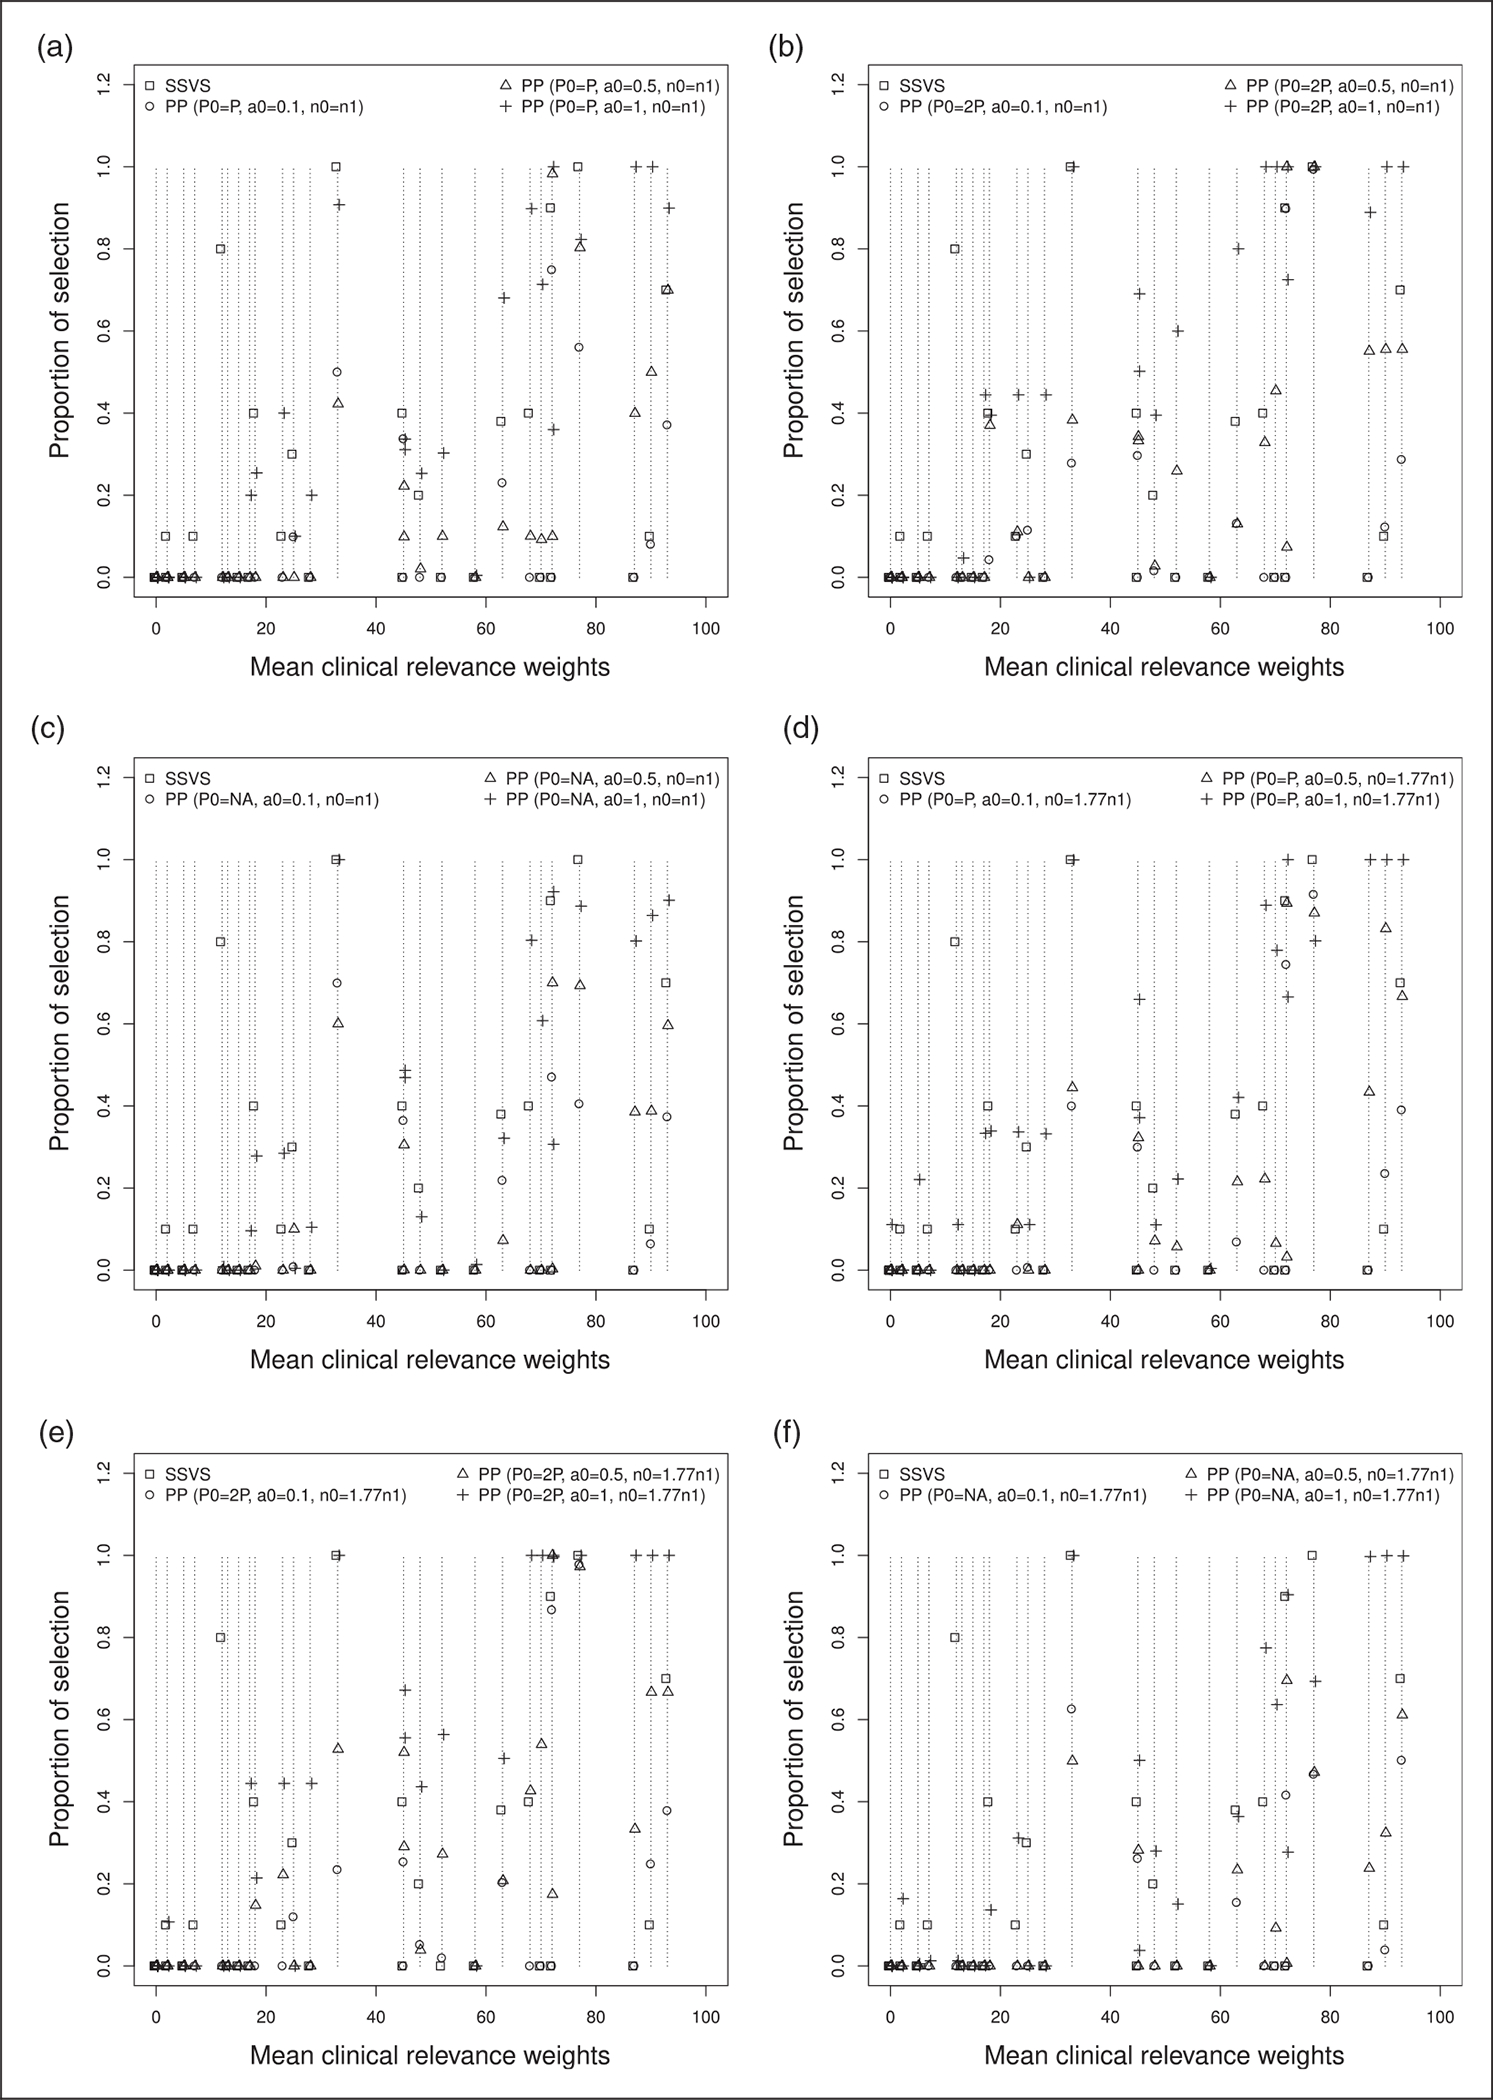
Proportion of times each variable is selected by the models against values of mean weights elicited by clinicians for approach 2, several values of P0, n0 and a0. Each model is labeled with a different symbol. (a) P0 = P, n0 = n1; (b) P0 = 2P, n0 = n1; (c) P0 = P/2, n0 = n1; (d) P0 = P, n0 = 1.77 × n1; (e) P0 = 2P, n0 = 1.77 × n1; and (f) P0 = P/2, n0 = 1.77 × n1.