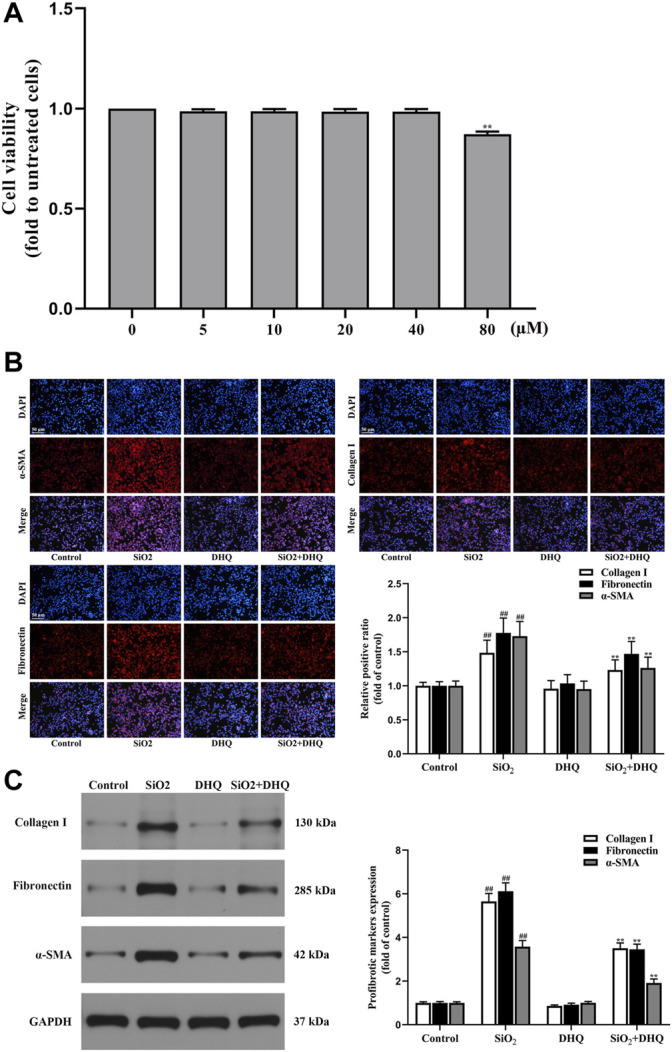
FIGURE 2.

DHQ inhibited profibrotic markers in fibroblasts. (A) Effects of WEL (0–80 µM) on cell viability were determined by the MTT assays, **p < 0.01 vs. the 40 µM. (B) Representative images ( × 200) of immunofluorescence analysis of α-SMA, collagen I and fibronectin in MRC-5 cells. Bar = 50 μM. (C) The protein levels of α-SMA, collagen I and fibronectin in MRC-5 cells were measured by western blotting. D Data are shown as mean ± SD (n = 3). #p < 0.05, ##p < 0.01 vs. the control group; *p < 0.05, **p < 0.01 vs. the SiO2 group.
