Figure 1.

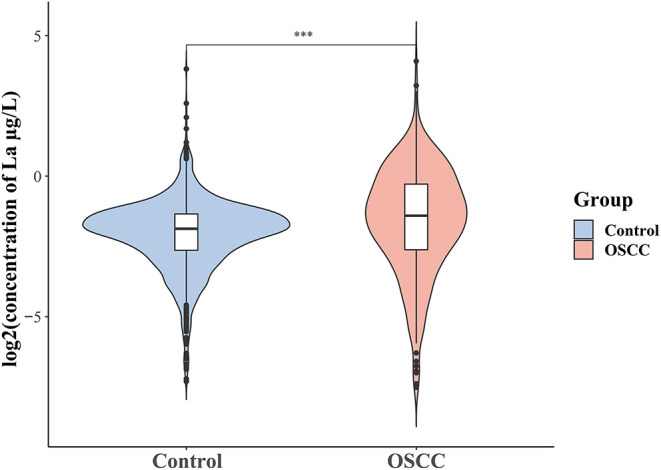
Distribution of serum La in case and control1 groups, for visualization purposes, we log2 transformed the measured la concentrations. ***P < 0.001 by Wilcoxon rank sum test.

Distribution of serum La in case and control1 groups, for visualization purposes, we log2 transformed the measured la concentrations. ***P < 0.001 by Wilcoxon rank sum test.