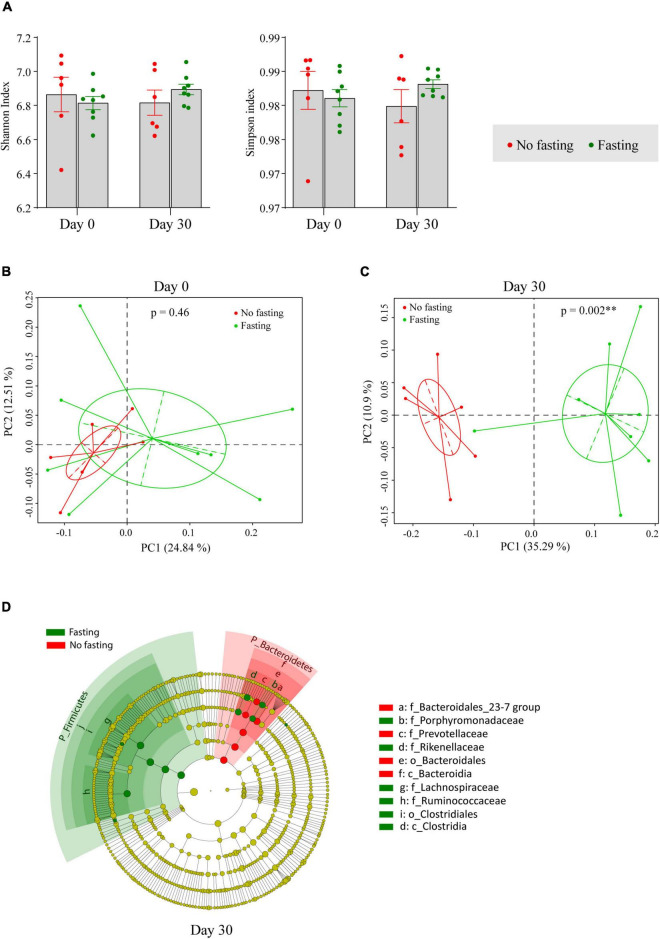
FIGURE 2.
IF shapes the composition of the gut microbiome in BALB/c mice. (A) Alpha diversity indexes were shown as Shannon and Simpson. The significance was calculated by unpaired student’s t-test. Bray–Curtis distance based Principal Co-ordinates Analysis (PCoA) of the gut microbiome in fasting and no fasting mice at day 0 (B) and day 30 (C). Different color represents different groups or time points of sample collection. Each point corresponds to a community from a single individual. Colors indicate community identity. Ellipses show the 95% confidence intervals. ** if p-value is less than 0.01 by ANOSIM test. (D) Taxa that show alternative abundance before and after fasting are depicted. Taxa with a log linear discriminant analysis (LDA) score above 4.00 as determined by using linear discriminant analysis coupled with effect size measurements (LEfSe). The hierarchy of the discriminating taxonomic levels was visualized as cladograms allowing taxonomic comparisons before and after fasting.

