FIGURE 3.
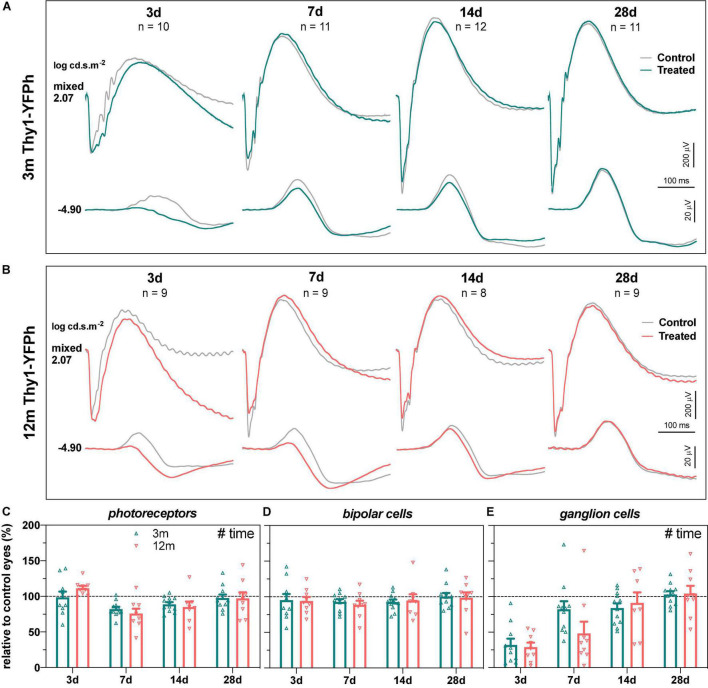
Recovery of retinal function in 3- and 12-month-old Thy1-YFPh mice. (A) Group averaged ERG waveforms in 3-month-old mice (teal traces, treated eyes; gray traces, control eyes) at luminous energies representing predominantly ganglion cell responses (–4.90 log cd.s.m–2) and outer retinal function (2.07 log cd.s.m–2) at 3 (n = 10), 7 (n = 11), 14 (n = 12), and 28 days (n = 11). (B) Group averaged ERG waveforms in 12-month-old mice (orange traces, treated eyes; gray traces, control eyes) at 3 (n = 9), 7 (n = 9), 14 (n = 8), and 28 days (n = 9). (C–E) ERG responses from IOP-treated eyes expressed relative to their contralateral control eyes for (C) photoreceptor amplitude, (D) bipolar cell amplitude, and (E) ganglion cell amplitude (pSTR) in 3-month-old (teal bars) and 12-month-old (orange bars) mice. Error bars, SEM; #, two-way ANOVA p < 0.05.

