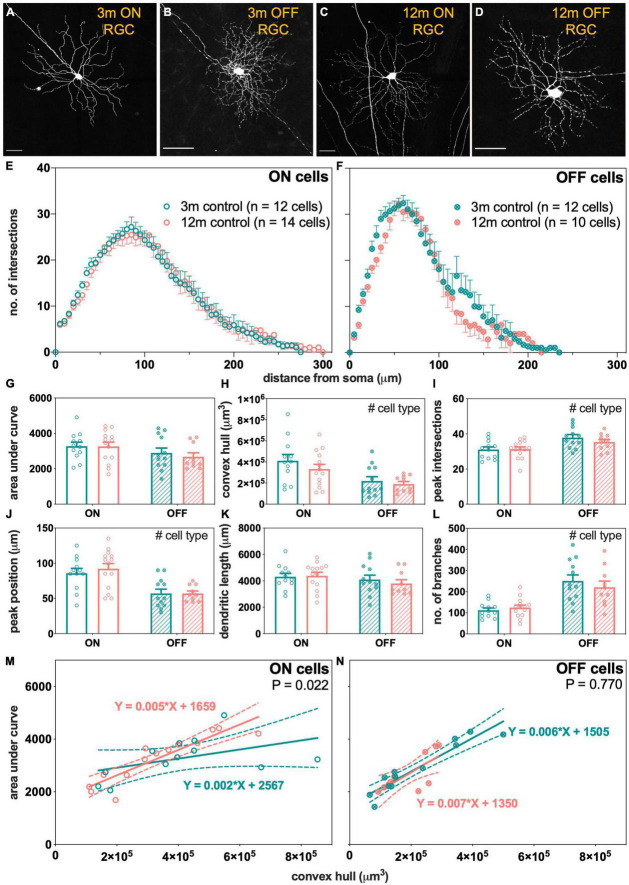
FIGURE 5.
Morphological assessment of ON and OFF RGCs in 3- and 12-month-old control eyes. (A–D) Maximum intensity projections of confocal image z-stacks displaying dendritic arbors of representative ON and OFF RGCs in 3- and 12-month-old mice. Scale bars, 50 μm. (E,F) Sholl profiles showing group averaged dendritic complexity (no. of intersections) relative to distance from soma in (E) ON [3 m, teal, n = 12 cells (4 animals); 12 m, orange, n = 14 cells (3 animals)] and (F) OFF [3 m, teal, n = 12 cells (4 animals); 12 m, orange, n = 10 cells (4 animals)] RGCs. (G) Area under curve for ON (unfilled bars) and OFF (patterned bars) of 3-month-old (teal) and 12-month-old (orange) RGCs. (H) Convex hull volume. (I) Peak number of intersections. (J) Peak position. (K) Total dendritic length. (L) Total number of branches. (M,N) Dendritic complexity (area under curve) with respect to cell size (convex hull volume) in (M) ON and (N) OFF RGCs. Error bars, SEM; #, mixed effects model p < 0.05; solid line, linear regression; dashed line, 95% confidence interval; p-value, statistical significance of difference in slopes.

