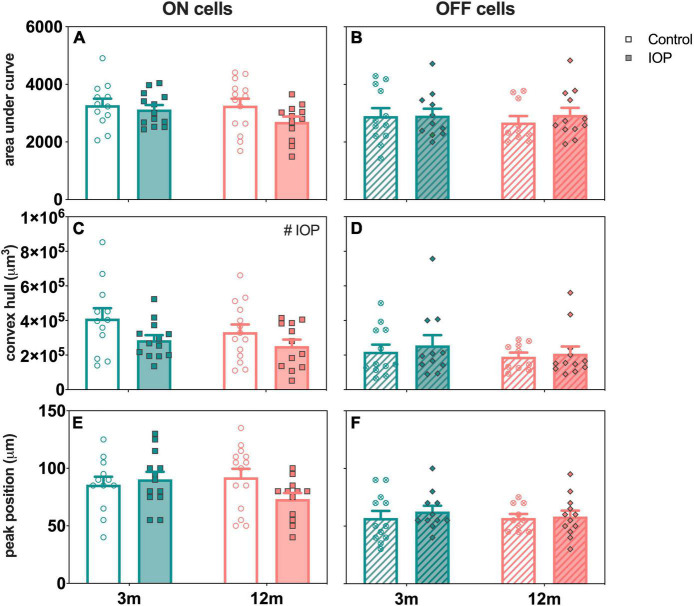
FIGURE 8.
Age comparison of ON (left column) and OFF (right column) RGCs in 3- and 12-month-old eyes 7 days after IOP elevation. (A,B) Area under curve in 3-month-old (teal) and 12-month-old (orange) eyes for control (unfilled bars) and IOP-treated (filled bars) of (A) ON (solid bars) and (B) OFF (patterned bars) RGCs. (C,D) Convex hull volume. (E,F) Peak position. 3-month-old ON [control, n = 12 cells (4 animals); treated, n = 13 cells (4 animals)] and OFF [control, n = 12 cells (4 animals); treated, n = 11 cells (4 animals)] RGCs. 12-month-old ON [control, n = 14 cells (3 animals); treated, n = 12 cells (4 animals)] and OFF [control, n = 10 cells (4 animals); treated, n = 12 cells (4 animals)] RGCs. Error bars, SEM; #, mixed effects model p < 0.05.

