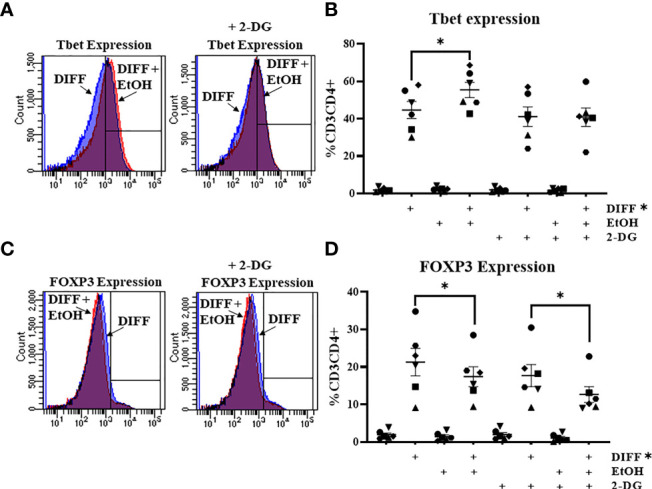
Figure 4.

Effect of 2-deoxyglucose (2-DG) on CD4+ T cells. (A) Representative FACS histograms plots of Tbet expression in DIFF, DIFF + EtOH, and DIFF+ EtOH + 2-DG CD4+ T cells. (B) The addition of 0.5 mM 2-deoxyglucose (2-DG) prevents the ethanol-mediated increase of Tbet-expressing CD4+ T cells. (C) Representative FACS histograms plots of FOXP3 expression in DIFF, DIFF + EtOH, and DIFF+ EtOH + 2-DG CD4+ T cells. (D) The addition of 0.5 mM 2-deoxyglucose (2-DG) did not alter the ethanol-mediated decrease of FOXP3-expressing CD4+ T cells. Naïve = undifferentiated and no ethanol treatment, EtOH = undifferentiated and ethanol-treated, DIFF = differentiated and no ethanol treatment, and DIFF + EtOH = differentiated and ethanol-treated. Data represents average values using CD4+ T cells from 6 donors expressed as mean ± SEM. Significant differences (p<0.05) were determined by repeated measures 3-way ANOVA. Post-hoc analysis was done using Sidaks multiple comparison test. *p ≤ 0.05.
