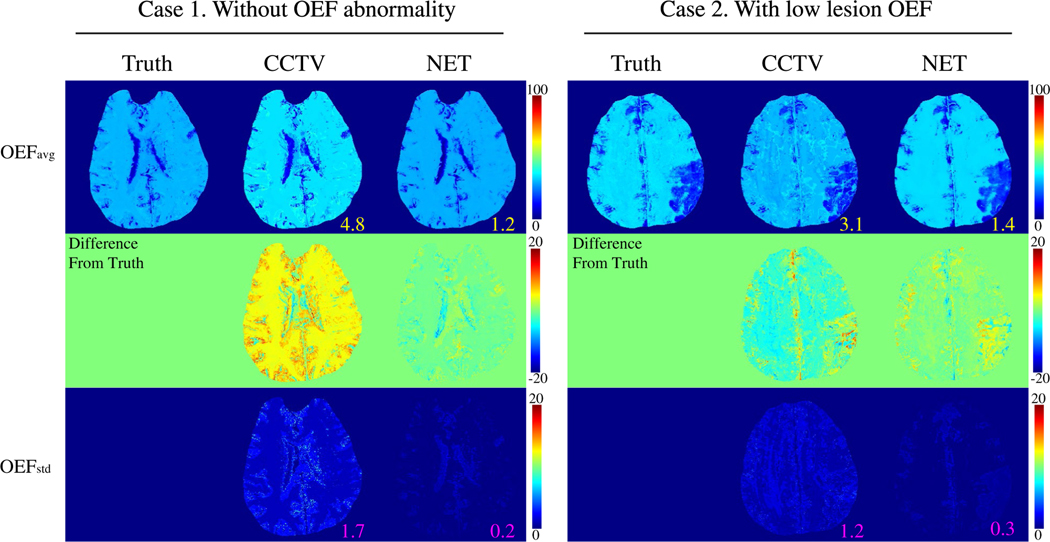
FIGURE 1.
Comparison between the OEFs obtained by CCTV and NET in two simulated brains (Test Data 1): Case 1. Without OEF abnormality and Case 2. With low lesion OEF. The numbers indicates MAE (yellow) and MSD (pink). NET provides greater accuracy (MAE: 4.8 vs. 1.2 % in Case 1 and 3.1 vs. 1.4 % in Case 2) and precision (MSD: 1.7 vs. 0.2 % in Case 1 and 1.2 vs. 0.3 % in Case 2). OEFavg and OEFstd indicate the average and SD OEF maps, respectively, among five trials. OEFavg and OEFstd are shown in the unit of [%]

