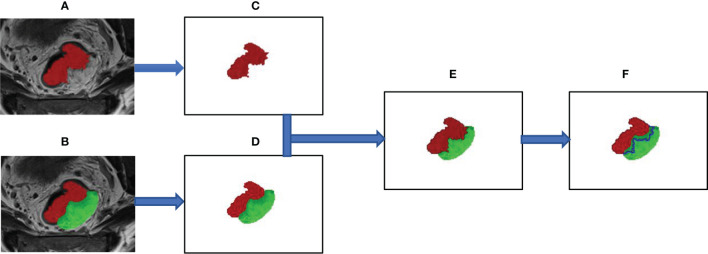
Figure 2.
The segmentation process of the region of interest for intratumor and peritumor. (A) The whole tumor was manually segmented on axial T2-weighted images and labeled as “intratumor” area (the red area). (B) Manually outline the area of the tumor bed (the green area), which is defined as the mesorectal area that the tumor has invaded. (C) Show the outline of the entire tumor. (D–F) The edge link to the “tumor bed” of “tumor” was dilated by 5 mm and subtracted to obtain the “peritumor” tissues (the blue area).

