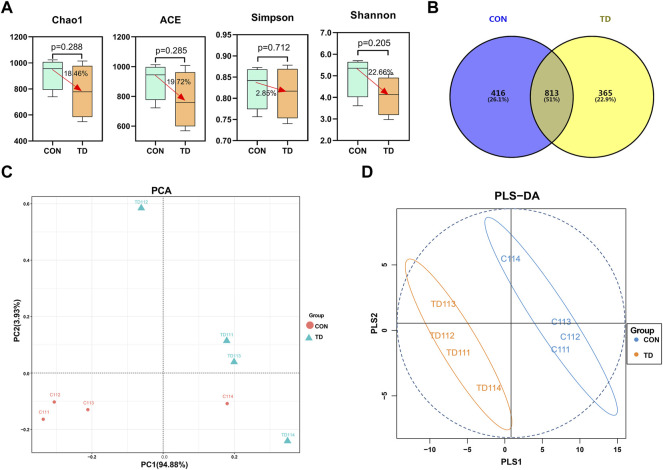
FIGURE 2.
Fecal microbial overall structure of broiler chickens. (A) Chao1, ACE, Simpson, and Shannon indices from the CON and TD groups were used to analyze the alpha diversity. Statistical analysis was performed by Kruskal-Willis test, a p-value lower than 0.05 (<0.05) has statistically significant, N = 4. (B) The Venn diagram showed the common and unique OTUs in the CON and TD groups of broiler chickens. (C) Unweighted Unifrac PCA estimates for the gut microbiota of the CON group (red) and TD group (green). (D) OPLS-DA analysis of gut-microbiota in the CON group (green) and TD group (orange-yellow) of broiler chickens.

