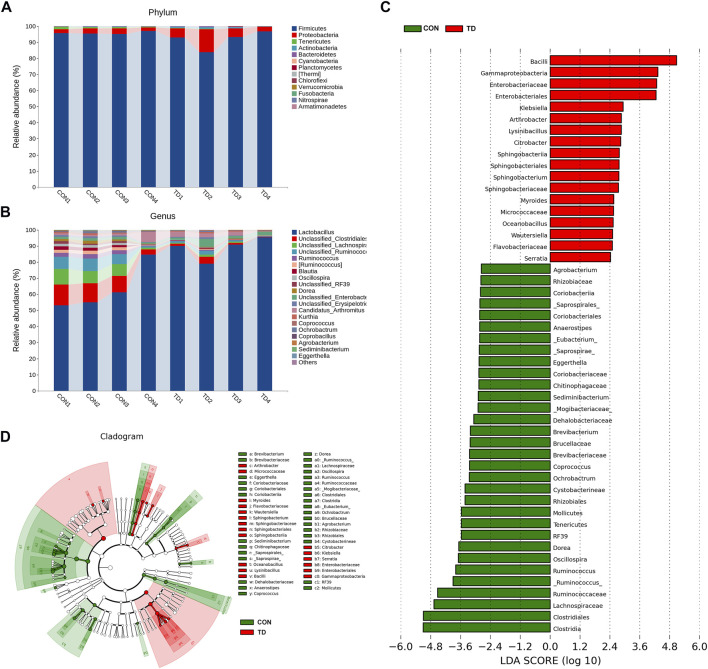
FIGURE 3.
Fecal microbial composition of broiler chickens. (A,B) Relative abundance of microbiota at the phylum level and the genus level (Top 20) in CON and TD groups. (C,D) LDA score and cladogram of LDA effect size (LEfSe) comparison analysis between the CON and TD groups. As indicated, the red, green shading represents bacterial taxa that were significantly higher in either the CON or TD group. The selection of discriminative taxa between the CON and TD groups was based on an LDA score cutoff of 2.0, and differences in the relative abundances of taxa were statistically determined based on a Wilcoxon’s signed-rank test at a significance level of 0.05 (N = 4).

