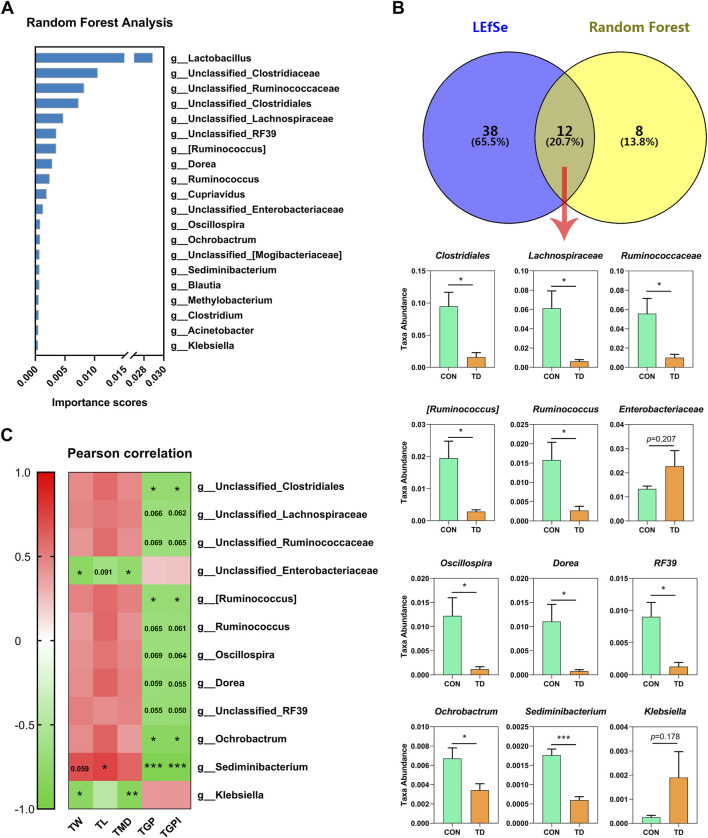
FIGURE 4.
Analysis of differential fecal microbiota in broiler chickens with TD. (A) Random forest analysis on fecal microbiome of CON and TD groups of broiler chickens. The y-axis, from top to bottom, displays the taxa (TOP 20) ranked by their importance (Mean Decrease Accuracy) for the group classification. (B) Venn analysis was performed to screen differential fecal microbiota through LEfSe and random forest model. The overlapping part of the Venn diagram represents the number of differential fecal microbiota in common between groups, and statistical analysis was performed on the relative abundances of the twelve differential bacterial families between groups and significantly different in terms of abundance by the Student’s t-test (N = 4). The asterisks indicate statistically significant differences and correspond to p < 0.05 (*) and p < 0.001 (***). (C) Pearson correlation analysis between the differential fecal microbiota and tibia-related parameters of broiler chickens with TD. The asterisks indicate statistically significant differences and correspond to p < 0.05 (*), p < 0.01 (**), and p < 0.001 (***). A p-value higher than 0.05 (>0.05) represents not statistically significant.

