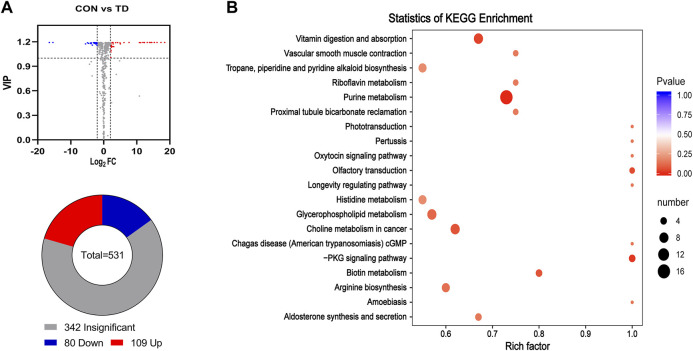
FIGURE 5.
Differential metabolites in feces of broiler chickens with TD. (A) Volcano plot analysis of fecal metabolites. Some significantly differential metabolites were selected out by using the criteria of FC ≧2 or FC ≦ 0.5 and VIP≧1 in the volcano plot. Significantly differential metabolites were shown as a red (up) or blue (down) dot, whereas a gray dot represented non-significant difference of metabolites. The number of differential metabolites is shown using a pie chart. (B) Potential metabolic pathways analysis based on significantly differential metabolites in feces from the CON and TD group chickens. The bubble size indicates the number of significant differential metabolites enriched in this pathway, and the point with the different gradation of color (from red to blue) represents the scope of p-value. The bigger size of each circle indicates a higher degree of enrichment, and the lower p-value represents a more significant degree of enrichment.

