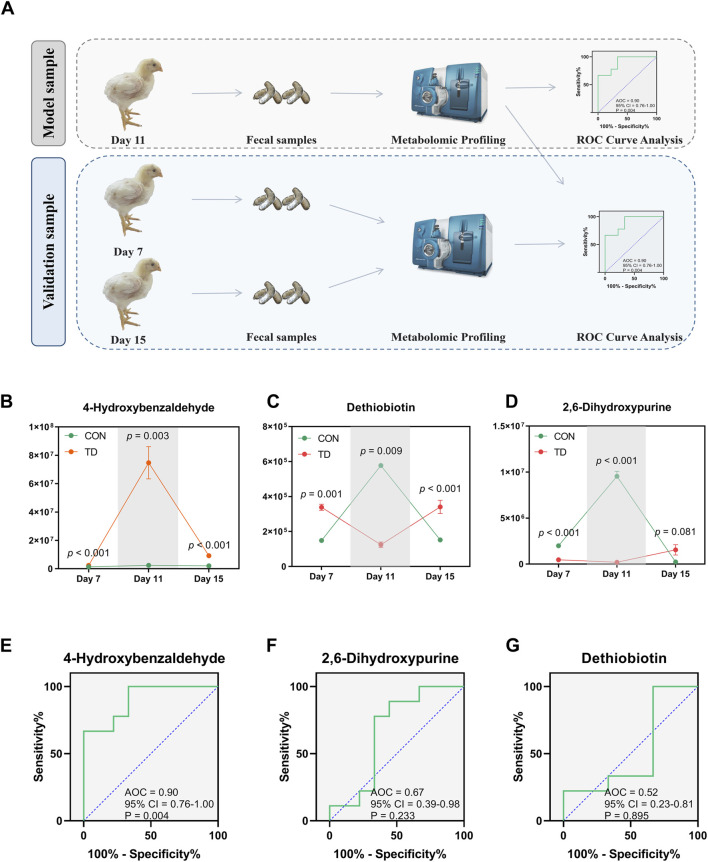
FIGURE 8.
Validation and evaluation of the predictive power of the three metabolites. (A) Design of verification experimental approach. (B–D) Statistical analysis was performed on the relative abundances of the three differential metabolites between groups by the Student’s t-test, a p-value < 0.05 was considered to be significant (N = 4). (E–G) Curves of ROC of differential metabolite biomarkers for diagnosis of TD during the entire trial. An AUC close to 1.0 indicates high sensitivity and specificity, a p-value < 0.05 was considered to be significant (N = 4).

