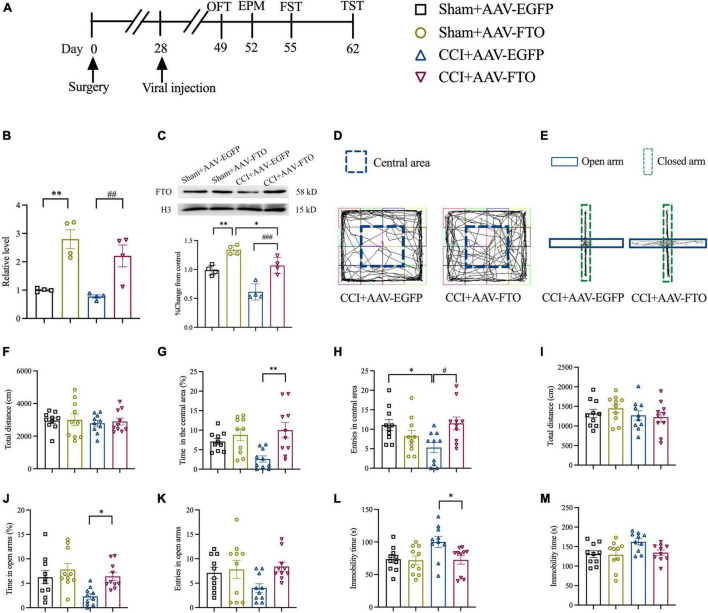
FIGURE 3.
Overexpression of FTO in ACC reversed anxiety- and depression-like behaviors in CCI mice. (A) The schematic diagram of the experimental arrangement. (B,C) qRT-PCR and Western blot results showed that the expression levels of FTO mRNA and protein in mice ACC 21 days after AAV injection (*P < 0.05, **P < 0.01 vs. Sham-AAV-EGFP; ##P < 0.01, ###P < 0.001 vs. CCI-AAV-EGFP, n = 4). (D) OFT trajectory. (E) EPM trajectory. (F) The total movement distance of mice during the OFT. (G) The proportion of residence time in the central area (**P < 0.01 vs. CCI-AAV-EGFP). (H) The number of entries of the central area (*P < 0.05 vs. Sham-AAV-EGFP; #P < 0.05 vs. CCI-AAV-EGFP). (I) The total movement distance of mice during the EPM. (J) The proportion of exploration time in open arm (*P < 0.05 vs. CCI-AAV-EGFP). (K) The number of entries of the open arm. (L,M) The immobility time during the FST and TST (*P < 0.05 vs. CCI-AAV-EGFP). n = 10.

