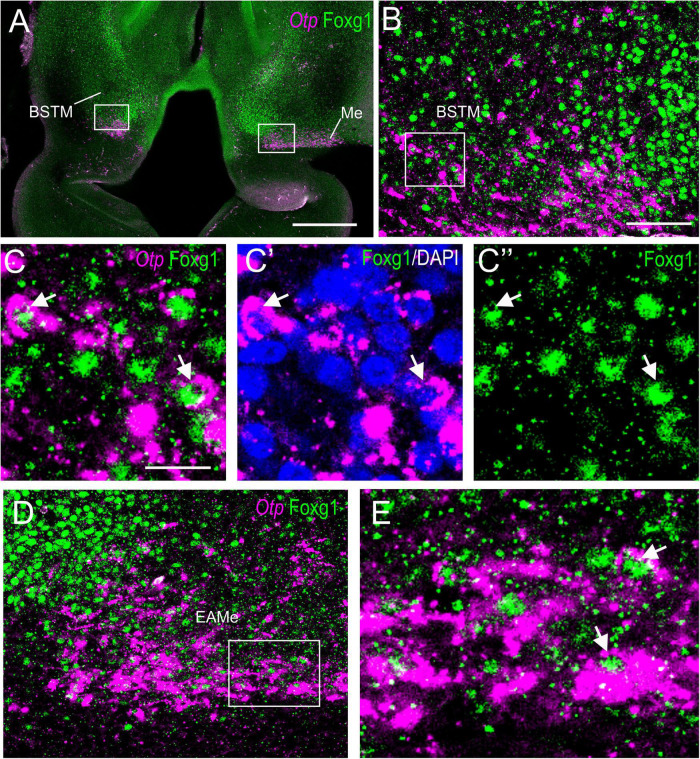
FIGURE 5.
Fluorescent double labeling of Otp and Fogx1 in chicken. (A) Horizontal section of the chicken embryonic forebrain, at E8, hybridized for Otp (magenta color) and immunostained for Foxg1 (green color). (B) Detail of the area squared in (A) (left side) showing coexpression of Otp and Foxg1 in many cells of the ventral part of BSTM (using topological references according to the prosomeric model). Panels (C–C′′) show the area squared at B at higher magnification (C: merged magenta/green channels; C′: magenta channel with DAPI; C′′: green channel). Arrows point to examples of double-labeled cells. (D) Detail of the area squared in (A) (right side) showing coexpression of Otp and Foxg1 in many cells of the medial extended amygdala (a cell corridor that extends from BSTM to the Me). Panel (E) shows the area squared at higher magnification (example of a double-labeled cell pointed with an arrow). See text for more details. For abbreviations, see list. Scale bars: (A) = 320 μm; (B) = 80 μm (applies to B,D); (C) = 20 μm (applies to C–C′′,E).

