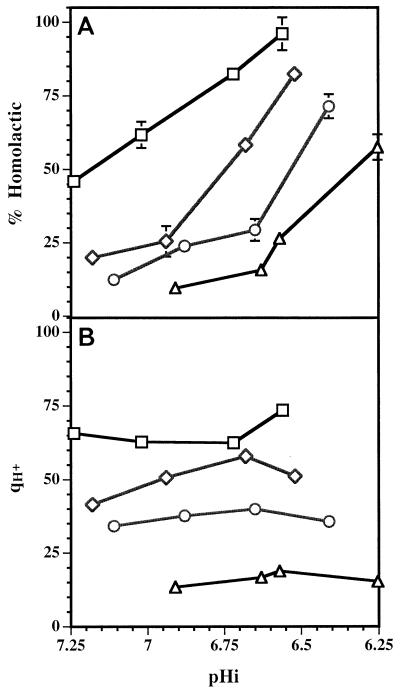
FIG. 2.
Changes in the fermentation of glucose by L. lactis subsp. cremoris NCDO 712 growing in chemostat cultures at dilution rates of 0.7 h−1 (□), 0.5 h−1 (◊), 0.33 h−1 (○), and 0.17 h−1 (▵) and at pHo values of 5.5 to 7.0. The corresponding pHi values are shown. (A) Amount of lactic acid produced, expressed as a percentage of the total amount of fermentation end products. (B) Overall qH+ (in millimoles per gram of protein per hour) for each culture. The standard deviations are indicated by error bars; in some cases the standard deviation was less than 3.8% and the error bar is smaller than the symbol.

