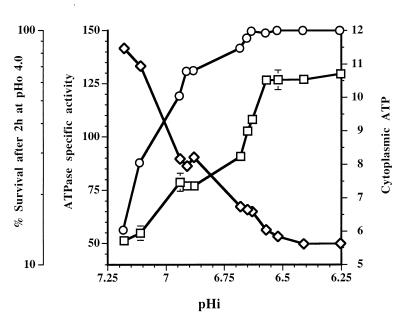
FIG. 9.
Relationships between percentage of survival after an acid challenge (pHo 4.0 for 2 h) (○), ATPase specific activity (in units per gram of protein per minute) (□), or cytoplasmic ATP concentration (in micromoles per gram of protein (◊) and pHi values of L. lactis subsp. cremoris NCDO 712 growing in chemostat cultures at dilution rates of 0.5, 0.33, and 0.17 h−1 and at pHo values of 5.5 to 7.0.

