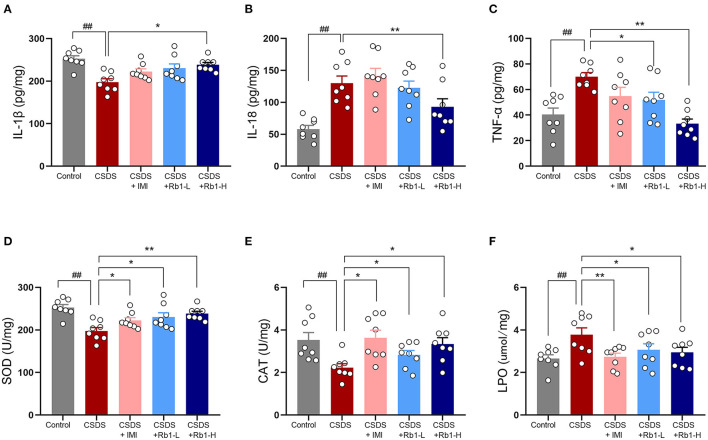
Figure 3.
Ginsenosides Rb1 and their effects on inflammatory and oxidative stress markers in CSDS mice; (A) Expression of IL-1β; (B) Expression of IL-6; (C) Expression of TNF-α; (D) SOD activity; (E) CAT-related activities; (F) Activity at the LPO level in the hippocampus. The entire data has been presented are means ± SEM; N = 10 mice per group. ##p < 0.01, considerably differed from control; *p and **p < 0.05, and 0.01, significantly varied from CSDS group.

