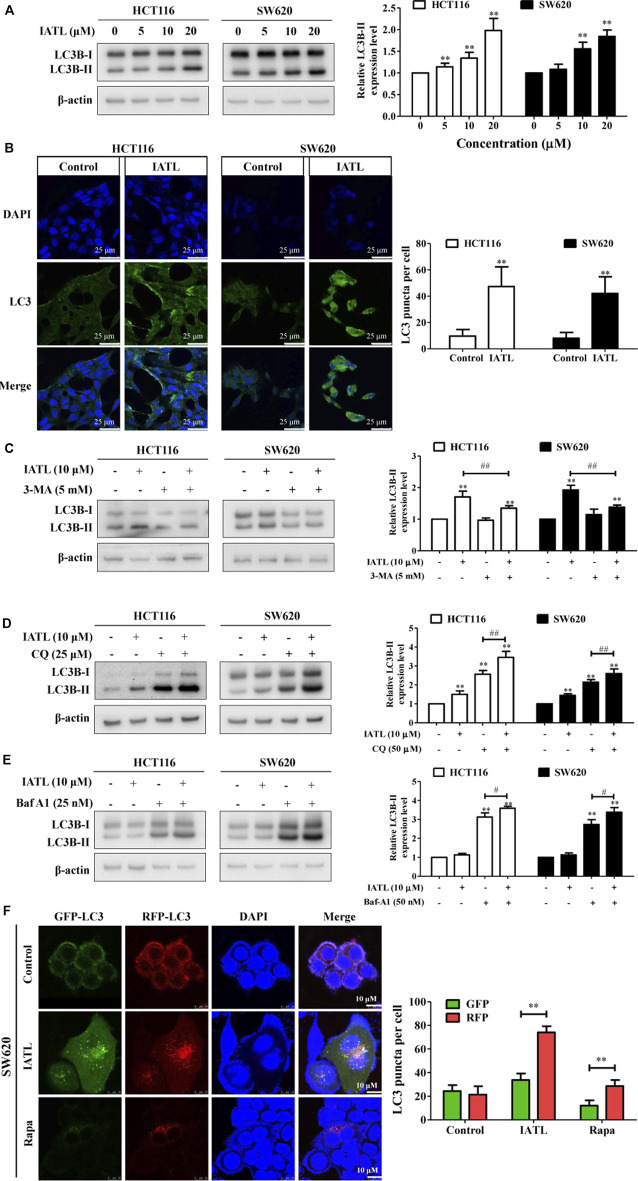
FIGURE 4.
IATL induces autophagy in CRC cells. (A) IATL upregulated protein levels of LC3B-II in CRC cells. Representative immunoblotting bands of LC3B and β-actin are presented in left panels and quantitative results for LC3B-II are shown in the right panels. (B) IATL increased the numbers of cytoplasmic LC3B puncta in HCT116 and SW620 cells. Cells were treated with 10 μM of IATL for 24 h LC3B puncta were visualized using immunofluorescence analyses. Representative images were photographed under a confocal microscope. Scale bar = 25 μM. Representative images (left panels) and the average numbers of green LC3B dots per cell (right panel) are shown. (C–E) Effects of IATL on LC3B-II protein level in the absence or presence of (C) 3-methyladenine (3-MA, 5 mM), (D) chloroquine (CQ, 25 μM) and (E) bafilomycin A1 (Baf-A1, 25 nM) in CRC cells. HCT116 and SW620 cells were treated with indicated drugs for 24 h. Protein levels were examined by immunoblotting. Representative immunoblotting bands are presented in left panels, and quantitative results are shown in right panels. Data in bar charts are presented as mean ± SD of three independent experiments. (F) IATL promoted autophagic flux in CRC cells. SW620 cells were transiently transfected with tandem sensor RFP-GFP-LC3B reagent. Rapa (100 nM) was used as a positive control. Representative images were photographed under a confocal microscope. Scale bar = 10 μM. Representative images (left panels) and the average numbers of red and green LC3B dots per cell (right panel) are shown. **p < 0.01 vs. vehicle control. # p < 0.05, ## p < 0.01.

