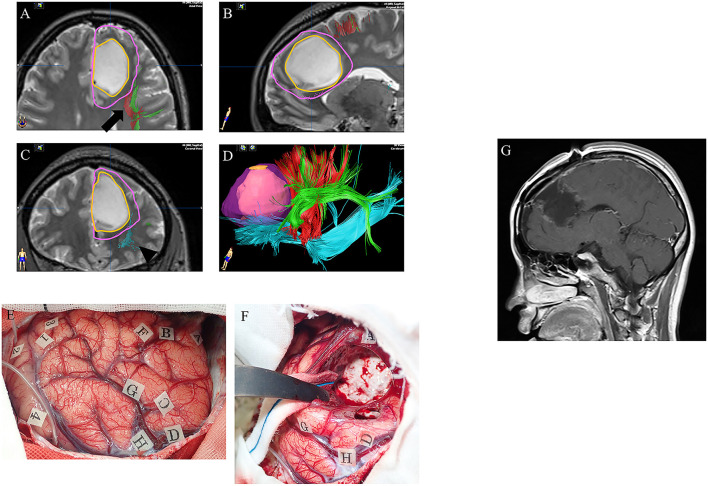
Figure 3.
A case of left frontal lower-grade glioma in a 30-year-old right-handed female with no relevant medical history. Preoperative axial (A), sagittal (B), and coronal (C) T2-weighted MRI show a high intensity mass in the left frontal lobe. Preoperative three-dimensional tractography (D) shows the tumor itself (orange) and the planned resection area (violet; supratotal resection) surrounded by FAT (red; arrow in panel A), SLF (green; arrow in panel A) and IFOF (blue; arrowhead in panel C). Red, FAT; green, SLF; blue, IFOF; FAT, frontal aslant tract; SLF, superior longitudinal fasciculus; IFOF, fronto-occipital fasciculus. Intraoperative photograph prior to resection (E), showing letter tags that indicate tumor boundaries (A–D) and the planned resection area for supratotal resection (E–H). Stimulation over the precentral gyrus induced speech arrest (number tags: 2 and 4), as did stimulation over the opercular part of the inferior frontal gyrus (number tags: 1 and 3). (F) Intraoperative photograph obtained after supratotal resection. Stimulation over the IFOF induced semantic paraphasia (number tag: 31), and stimulation over the FAT induced speech arrest (number tags: 33, 34). FAT, frontal anterior tract; IFOF, fronto-occipital fasciculus. Postoperative sagittal T1-weighted MRI with gadolinium enhancement (G) showing supratotal resection with awake brain mapping.

