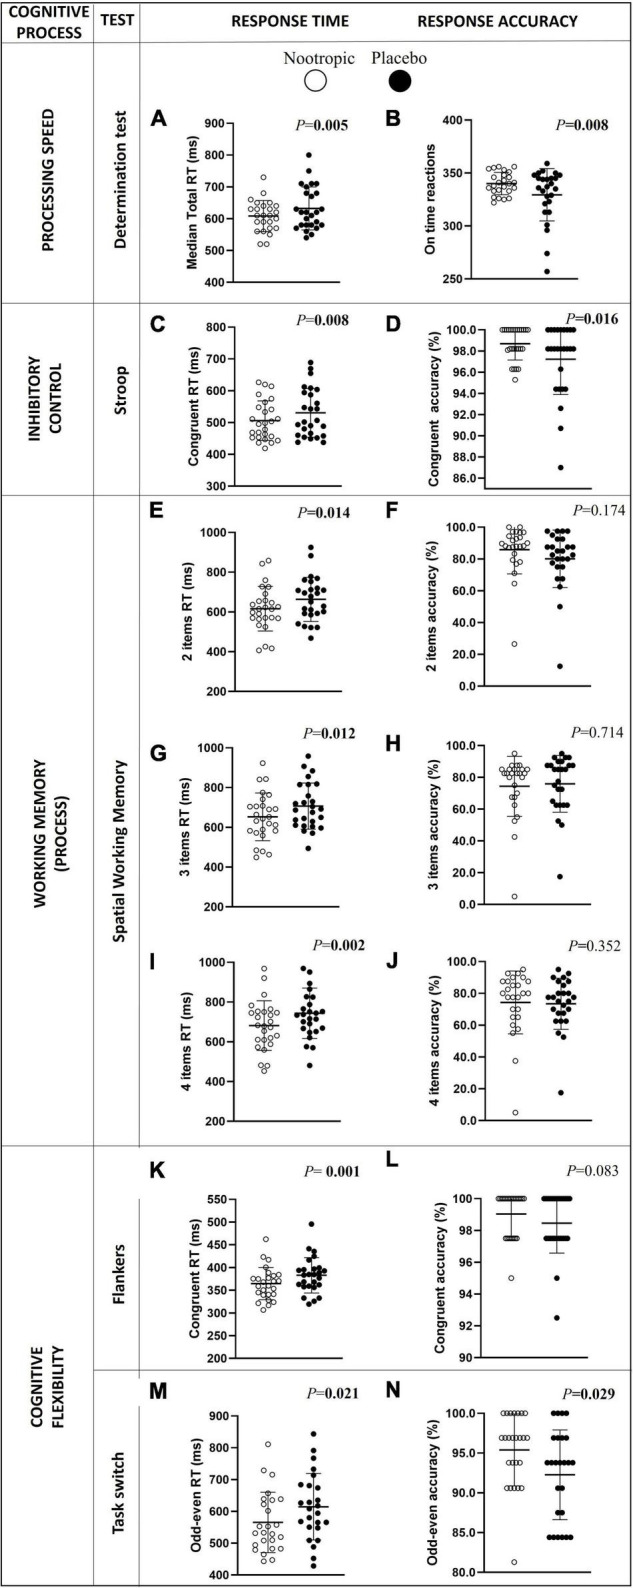
FIGURE 2.

Differences in choice processing speed (A,B), inhibitory control (C,D), spatial working memory (D–J), and cognitive flexibility RT (K–N) and accuracy between the acute ingestion of the nootropic (denoted as white circles) and the placebo (denoted as black circles). Circles represent individual values, whereas lines represent mean (i.e., central line) and standard deviation. Differences between nootropic and placebo were analyzed using the Wilcoxon test. Boldfaced values mean P < 0.05. RT, response time.
